
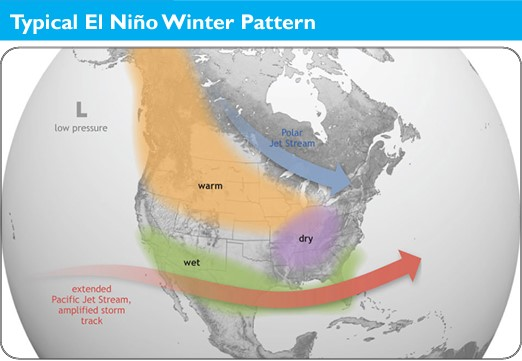
As fall comes to a close, those who live and work in the Great Lakes region are wondering what weather this winter has in store. An El Niño Advisory is currently in effect, which means El Niño conditions have developed and are expected to continue. So, what does that mean for the Great Lakes? Will we still see lake effect snow?
An El Niño shifts the odds towards warmer, drier weather across the region – but that certainly doesn’t mean no snow! Whether or not there’s an El Niño, lake effect snow events can and do occur in the Great Lakes every year. In fact, we’re already experiencing them this year in places like Buffalo, NY and western Michigan.
What is lake effect snow?
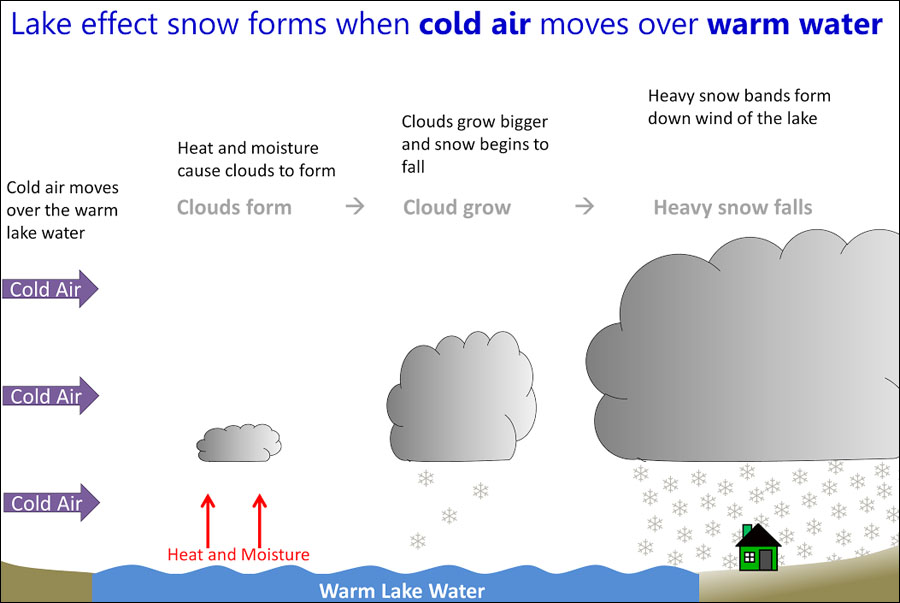
In the Great Lakes region, hazardous winter weather often happens when cold air descends from the Arctic region. Lake effect snow is different from a low pressure snow storm in that it is a much more localized and sometimes very rapid and intense snow event. As a cold, dry air mass moves over the unfrozen and relatively warm waters of the Great Lakes, warmth and moisture from the lakes are transferred into the atmosphere. This moisture then gets dumped downwind as snow.
Lake Effect Snow Can Be Dangerous
Lake effect snow storms can be very dangerous. For example, 13 people were killed by a storm that took place November 17-19, 2014 in Buffalo, New York. During the storm, more than five feet of snow fell over areas just east of Buffalo, with mere inches falling just a few miles away to the north. Not only were lives lost, but the storm disrupted travel and transportation, downed trees and damaged roofs, and caused widespread power outages. Improving lake effect snow forecasts is critical because of the many ways lake effect snow conditions affect commerce, recreation, and community safety.

Why is lake effect snow so hard to forecast?
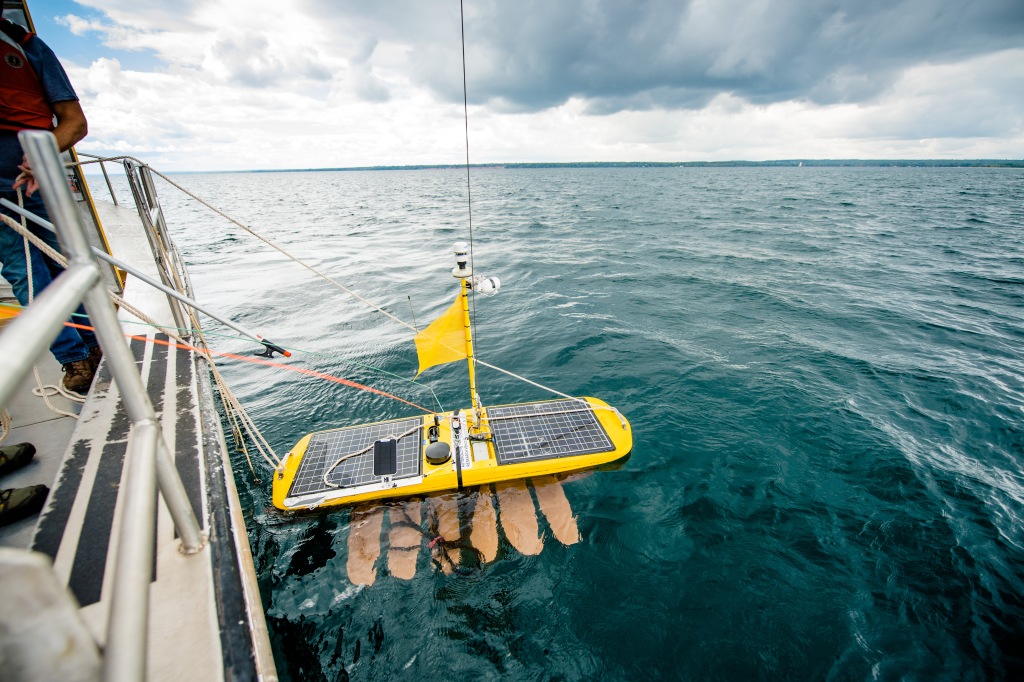
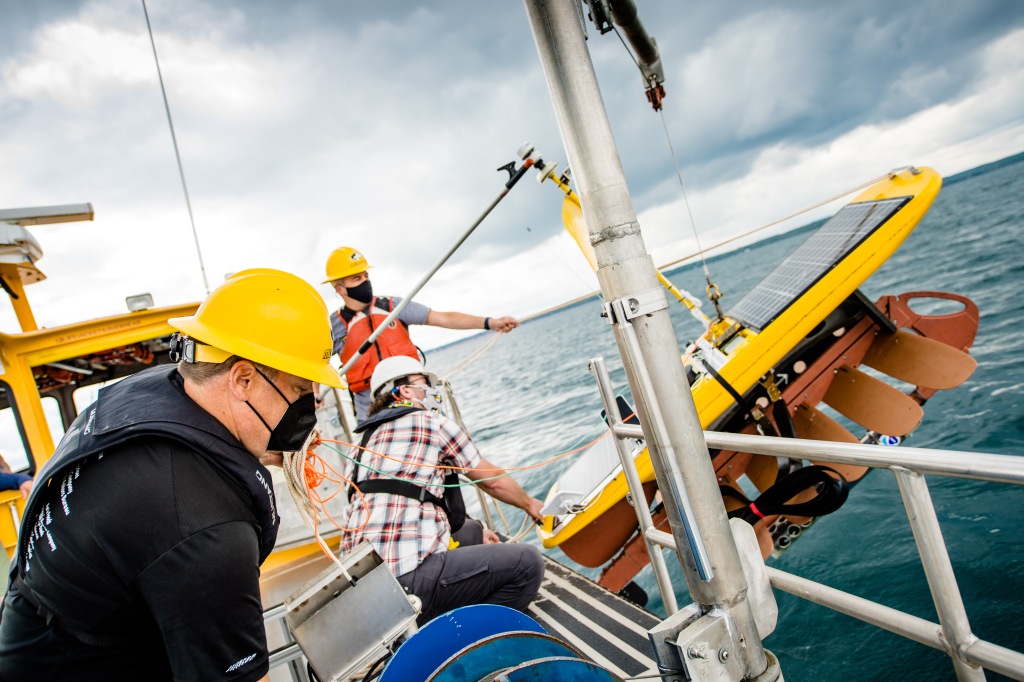
There are a number of factors that make lake effect snow forecasting difficult. The widths of lake-effect snowfall bands are usually less than 3 miles — a very small width that makes them difficult to pinpoint in models. The types of field measurements scientists need to make forecasts better are also hard to come by, especially in the winter! We would like to take frequent lake temperature and lake ice measurements, but that is difficult to do during the winter, as conditions are too rough and dangerous for most research vessels and buoys. (However, NOAA is making progress towards expanding our Great Lakes winter observation capabilities!)
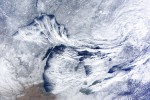
Satellite measurements can also be hard to come by, as the Great Lakes region is notoriously cloudy in the winter. It’s not uncommon to go for over a week without usable imagery.

NOAA GLERL and CIGLR work to improve lake effect snow forecasting
Currently, NOAA Great Lakes operational models provide guidance for lake effect snow forecasts and scientists at NOAA GLERL and the Cooperative Institute for Great Lakes Research (CIGLR) are conducting studies to improve them.
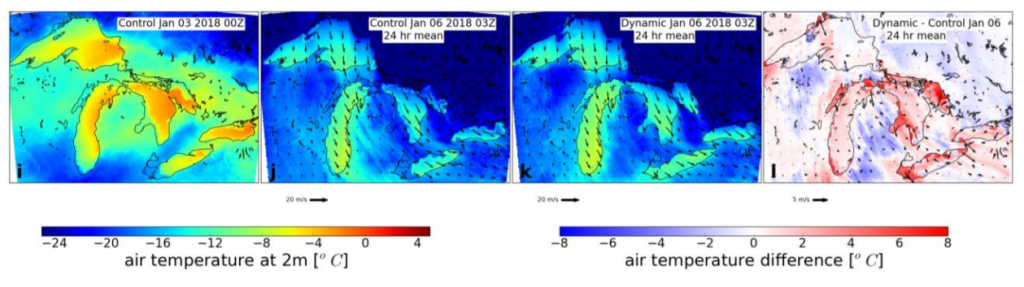
They use data from lake effect snow events in the past and compare how a new model performs relative to an existing model. One way to improve forecast model predictions is through a model coupling approach, or linking two models so that they can communicate with each other. When they are linked, the models can share their outputs with each other and produce a better prediction in the end.
Research published by CIGLR, GLERL and other research partners, “Improvements to lake-effect snow forecasts using a one-way air-lake model coupling approach,” is part of a series of studies (see list below) that help to make lake effect snow forecasts better. This study takes a closer look at how rapid changes in Great Lakes temperatures and ice impact regional atmospheric conditions and lake-effect snow. Rapidly changing Great Lake surface conditions during lake effect snow events are not accounted for in existing operational weather forecast models. The scientists identified a new practical approach for how models communicate that does a better job of capturing rapidly cooling lake temperatures and ice formation. This research can result in improved forecasts of weather and lake conditions. The models connect and work together effectively and yet add very little computational cost. The advantage to this approach in an operational setting is that computational resources can be distributed across multiple systems.
Our lake effect snow research continues
Our lake effect modeling research is ongoing, and NOAA GLERL, CIGLR, NOAA NWS Detroit, the NOAA Global Systems Laboratory continue to address the complex challenges and our studies build upon each other to improve modeling of lake-effect snow events. A future focus will be on running the models on a smaller grid scale and continuing to work to improve temperature estimates as both are key to forecasting accuracy.
Related news articles and blog posts:
Improving Lake Effect Snow Forecasts
Improving lake effect snow forecasts by making models talk to each other
Related research papers:
Fujisaki-Manome et al. (2022) Forecasting lake-/sea-effect snowstorms, advancement, and challenges
Fujisaki-Manome et al. (2020) Improvements to lake-effect snow forecasts using a one-way air-lake model coupling approach.
Anderson et al. (2019) Ice Forecasting in the Next-Generation Great Lakes Operational Forecast System (GLOFS)
Fujisaki-Manome et al. (2017) Turbulent Heat Fluxes during an Extreme Lake-Effect Snow Event
Xue et al. (2016) Improving the Simulation of Large Lakes in Regional Climate Modeling: Two-Way Lake-Atmosphere Coupling with a 3D Hydrodynamic Model of the Great Lakes


