Throughout 2024, NOAA’s Great Lakes Environmental Research Laboratory (GLERL) proudly celebrates its 50th anniversary!
NOAA GLERL is one of ten Federal research laboratories in the Oceanic and Atmospheric Research line office of NOAA. Designated on April 25, 1974, GLERL was established to provide a focus for NOAA’s environmental and ecosystem research in the Laurentian Great Lakes. The original GLERL was formed by merging staff from the Limnology and Computer Divisions of the Lake Survey Center of NOAA’s National Ocean Service with the staff of the International Field Year for the Great Lakes Office.
GLERL has made many important scientific contributions to the understanding and management of the Great Lakes and other coastal ecosystems. GLERL scientists regularly engage with academic, state, federal, and international partners. GLERL research provides information and services to support decisions that affect the environment, recreation, public health and safety, and the economy of the Great Lakes and coastal marine environments.
The Early Years
Algal blooms caused by excess nutrients were one of the major environmental issues in the 1970s, and a GLERL-developed phosphorus model was used by the International Joint Commission to determine loading limits. By 1980, the laboratory had expanded to include a major research effort on the cycling of sediment particles and associated toxic organics, which were recognized in the Great Lakes Water Quality Agreement as a major environmental problem. GLERL scientists led some of the early work in identifying and evaluating processes affecting the deposition and cycling of contaminants in the lakes. This work showed that the sediment zone is a major repository for contaminants and also a major source for recycling contaminants to the water column and food web. A Great Lakes oil spill model was put into operational use and successfully predicted the drift of an abandoned ship.
GLERL staff worked cooperatively with other agencies to develop research projects focused on major environmental issues in keeping with NOAA’s mission and goals. GLERL’s water resources research focus was expanded to include the impacts of climate change on the Great Lakes, which has led to GLERL’s participation in the national Water Resources Forecasting Program. GLERL’s scientific expertise on the movement and cycling of sediment particles, and circulation measurements and modeling, has led to several large joint research programs with the U.S. Environmental Protection Agency to develop contaminant mass balance models for selected areas: the Upper Great Lakes connecting channels, Green Bay, and Lake Michigan. Also during this time, microcinematography was used to understand zooplankton behavior and predation.
1980s
Facilities and the Cooperative Institute for Great Lakes Research
In 1987, GLERL moved to a new facility in northeast Ann Arbor. This permitted consolidation of laboratories and marine instrumentation space for the first time. The Cooperative Institute for Limnology and Ecosystems Research (CILER), now known as the Cooperative Institute for Great Lakes Research (CIGLR), was established in 1989 in an agreement between NOAA, the University of Michigan, and Michigan State University.
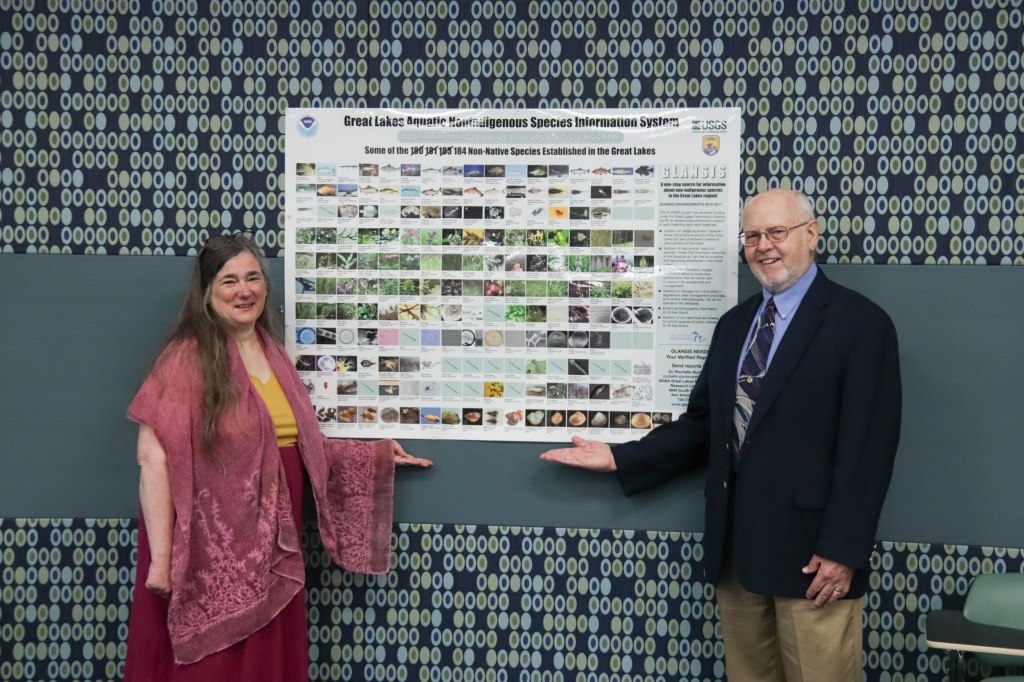
Research on Invasive Species
In 1989, GLERL launched a small research project on nonindigenous species. Research started with the ecosystem impacts of Bythotrephes, the “spiny water flea,” which had spread through most of the Great Lakes. However, with the discovery of Zebra mussels (Dreissena polymorpha) in Lake St. Clair, and the passage of the Nonindigenous Aquatic Nuisance Prevention and Control Act of 1990, GLERL was tasked with developing a major program on nonindigenous species, focusing on the ecosystem and environmental effects of the Zebra mussel. Through this program, GLERL scientists discovered the dramatic decline of the important, native amphipod Diporeia, first noted in Lake Michigan in the early 1990s. The ramifications of the Diporeia decline have been far reaching, affecting a series of ecologically and economically important fish.
1990s
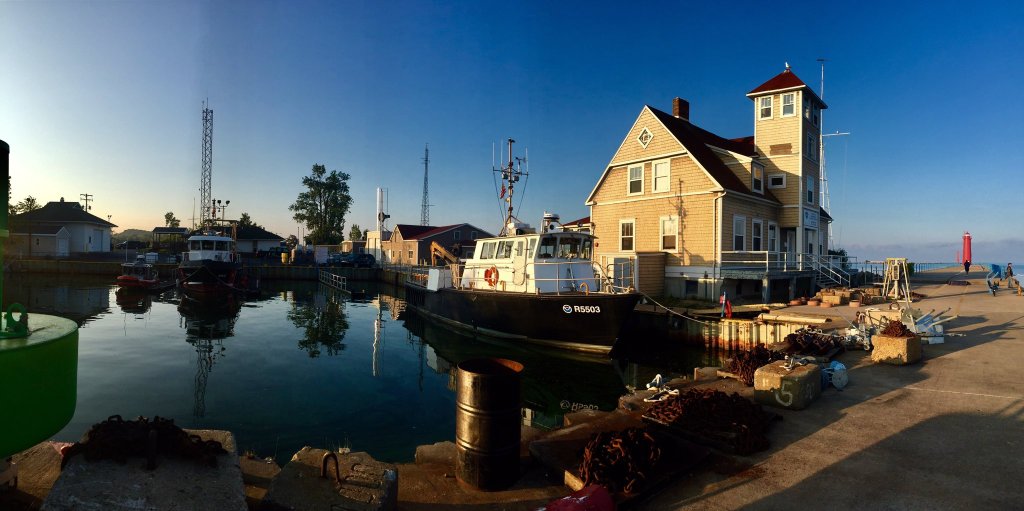
Lake Michigan Field Station
In 1990, GLERL assumed ownership of the former Coast Guard base at Muskegon, Michigan on the south side of the channel between Muskegon Lake and Lake Michigan. The site includes three buildings and research vessel dockage next to the main building. The U.S. Coast Guard established the Muskegon Life Saving Station in 1879, and a building was constructed at the current location in 1905. With its distinctive building architecture and prime location adjacent to public parks, the field station has become an icon of the Muskegon community. In 1995, the site was officially named the Lake Michigan Field Station.
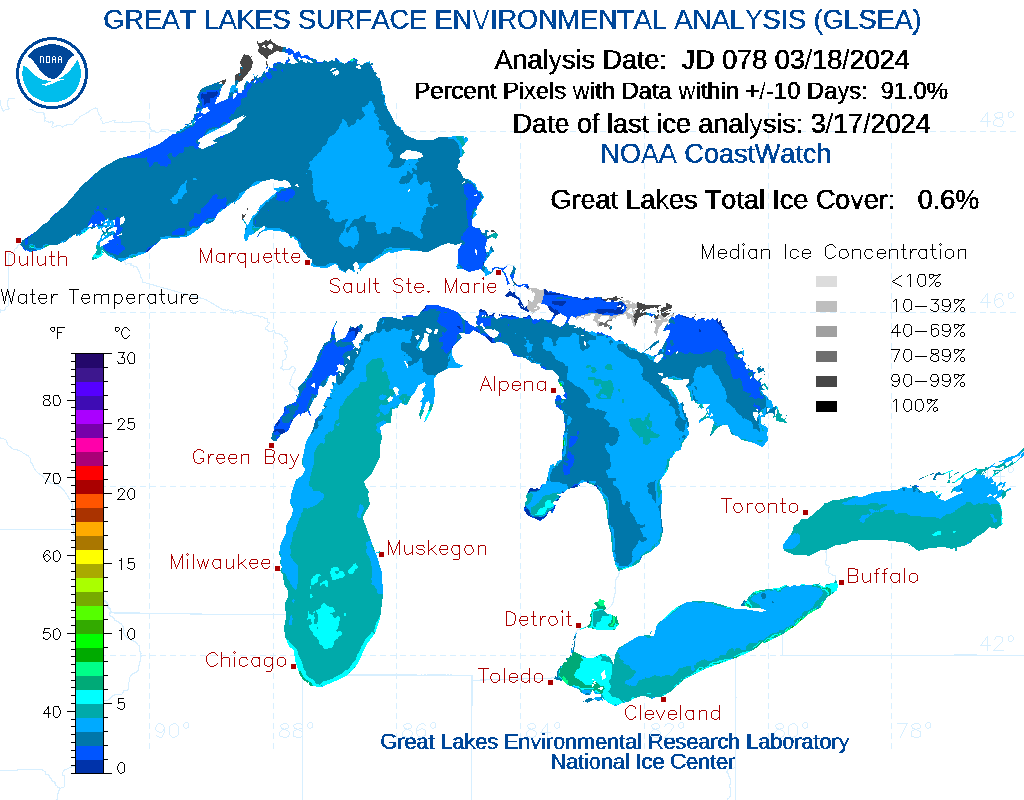
Great Lakes CoastWatch Node
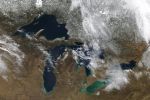
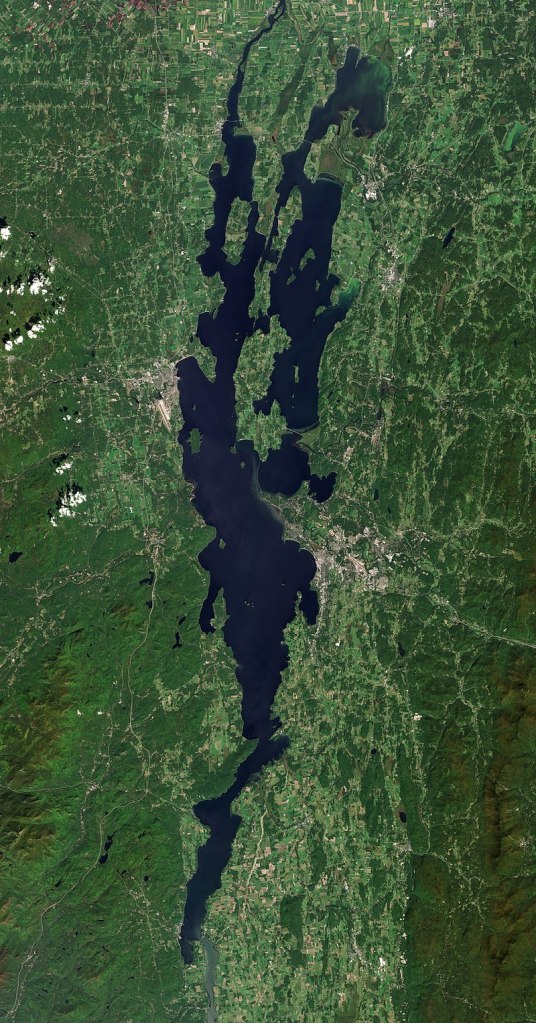
In 1990 the Great Lakes CoastWatch node was established as part of NOAA’s nationwide CoastWatch program, which helps people access and use global and regional satellite data for ocean and coastal applications. Great Lakes CoastWatch delivers environmental data and products for near real-time observation of the Great Lakes. It supports ecological forecasting, monitoring algal blooms, tracking sediment plumes, studying temperature effects on fish populations, and more.

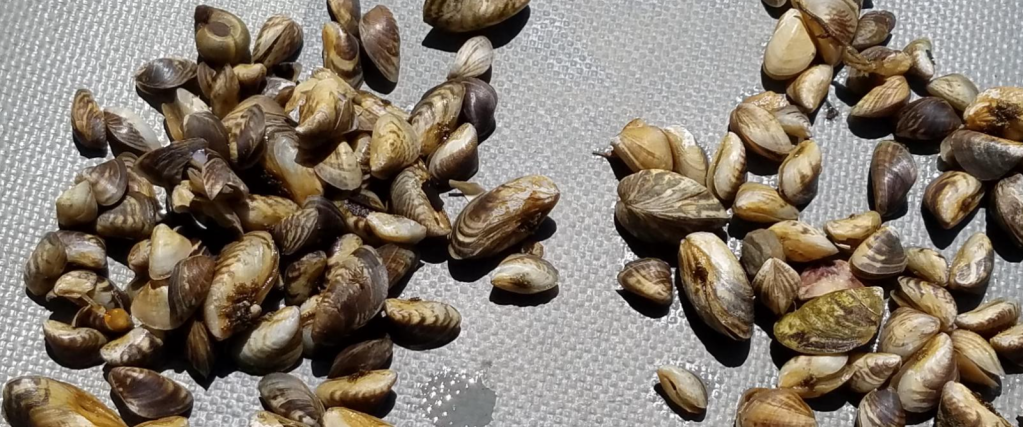
Invasive mussel research
GLERL’s experimental work on invasive Dreissenid mussels expanded in the 1990s, focusing on feeding, growth, nutrient excretion, and other processes to help to explain mussels’ impacts on Great Lakes’ food webs. Now, the understanding gained from these studies is used by resource managers to inform decisions that support coastal infrastructure and economically important fisheries.
Episodic Events Great Lakes Experiment
A large, interdisciplinary research program known as EEGLE (Episodic Events Great Lakes Experiment) was led by GLERL scientists from 1997 to 2002. The project sought information on the importance of resuspended materials caused by spring storm events in Lake Michigan. This project served as the foundation for GLERL’s present-day Real-time Coastal Observation Network.
Expanding GLERL’s reach
In 1994, the first GLERL website went live. In 1998, GLERL became involved in the National Ocean Sciences Bowl Midwest Regional Competition for high school students, which continues to be an important annual outreach event hosted by the University of Michigan School for Environment and Sustainability and Michigan Sea Grant.
2000s
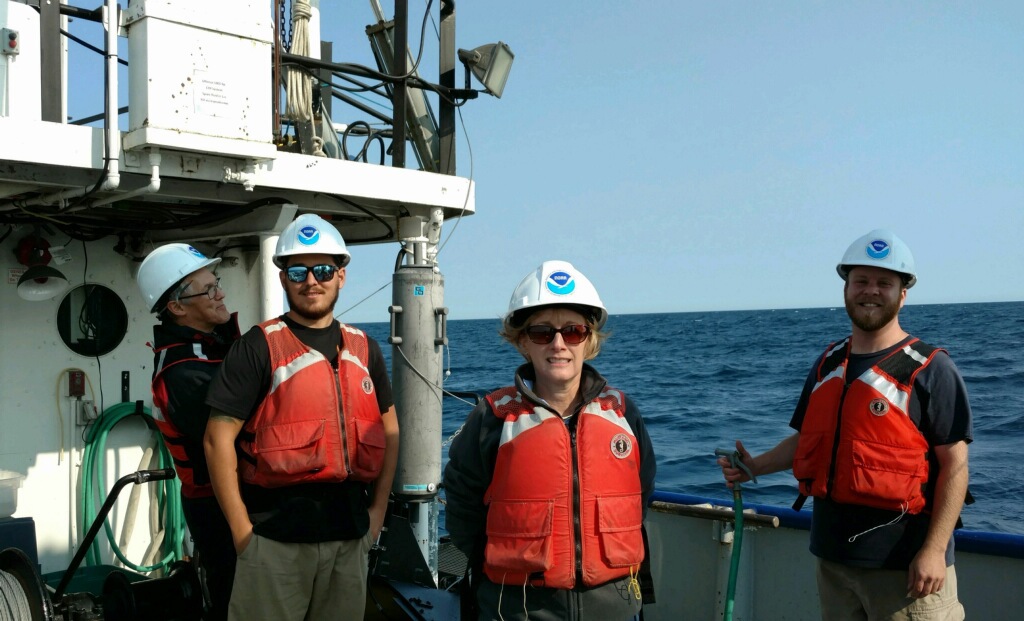
A new era of research vessels and facilities
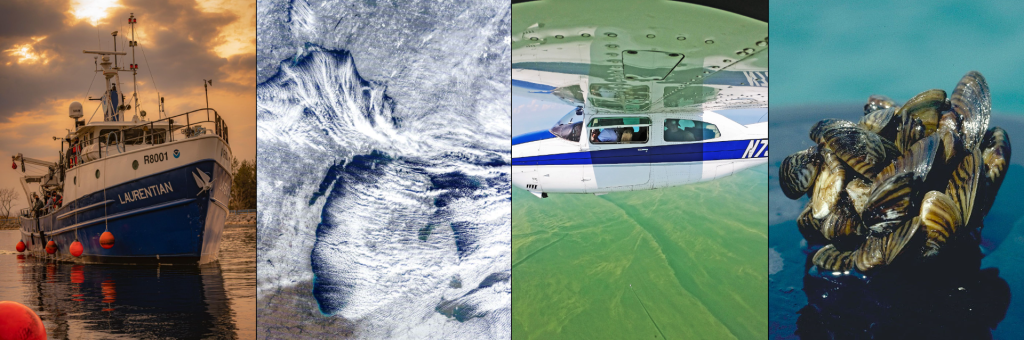
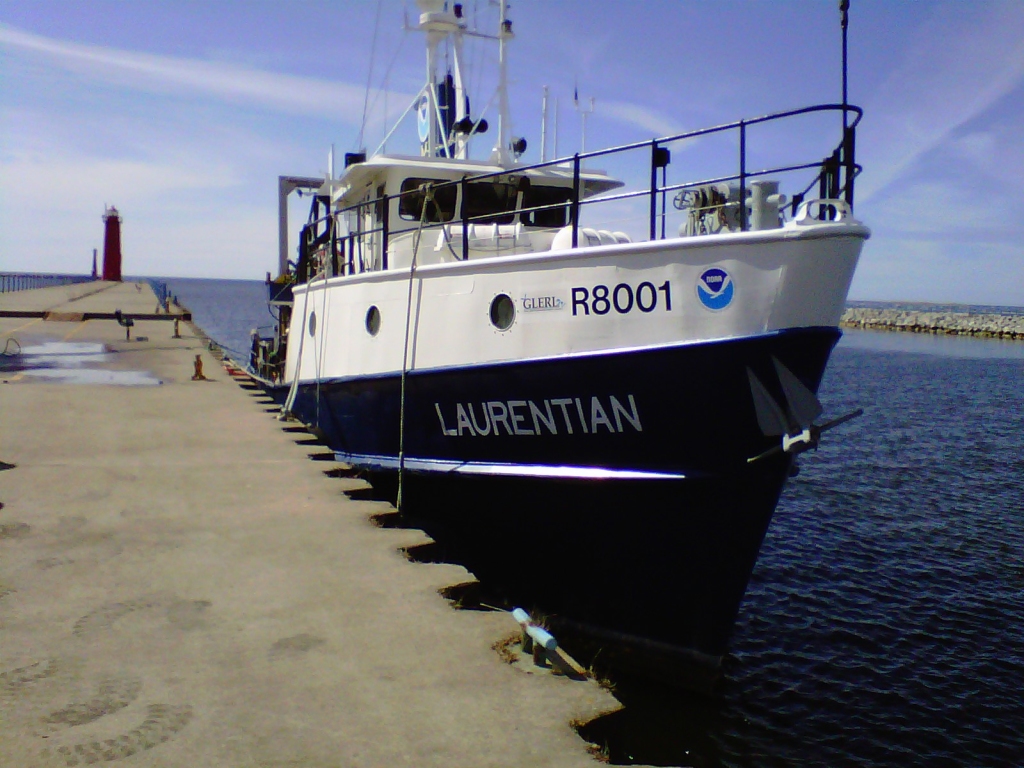
In 2002, GLERL acquired the research vessel Laurentian from the University of Michigan. The 80-foot vessel is part of a fleet that includes other large vessels and small boats. In 1999, staff at the Lake Michigan Field Station began retrofitting GLERL’s vessels to run on biofuels and achieved the goal of becoming a ‘petroleum-free’ fleet by 2006. Today, GLERL is helping other Federal agencies “green” their vessels through the Federal Green Fleet Working Group, formed in 2010.
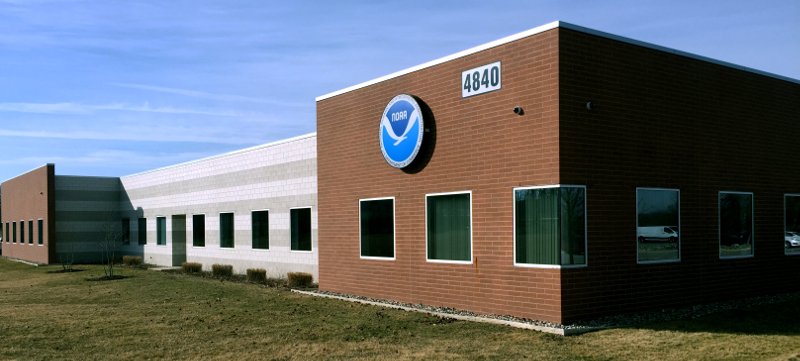
In late 2008, GLERL’s Ann Arbor facility moved across town to a new facility with much greater square footage and improved laboratory facilities, marine instrumentation storage and staging areas, and conference room space.
Supporting ballast water laws with invasive species research
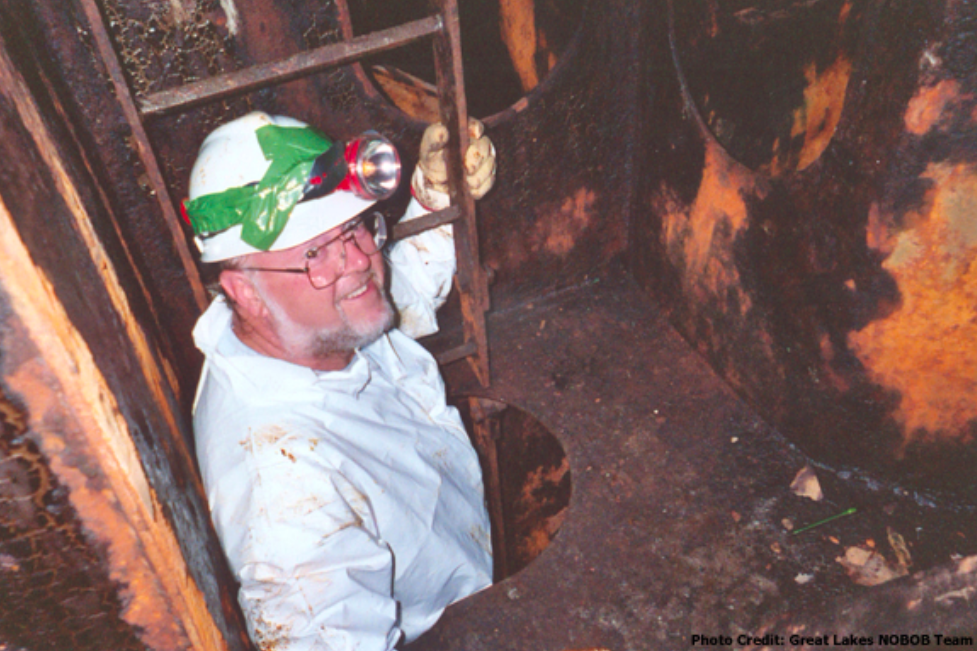
In the early to mid-2000s, GLERL’s invasive species research played an instrumental role in providing scientific evidence to support the improvement of ballast water management legislation for commercial shipping traffic entering the Great Lakes, known as the No-Ballast-On-Board (NOBOB) project. While management of ballasted foreign ships was relatively well established, essentially nothing was known about the extent and mechanisms of aquatic invasive species (AIS) introductions related to foreign ships that entered the Great Lakes under the NOBOB designation.

The results of this project provided the core science needed to implement key ballast water management regulations in Canada and the U.S. to mitigate invasions from NOBOB vessels. Through GLERL’s scientific efforts and leadership of a world-class team of researchers, we have since seen a sharp decline in the introduction of new AIS into the Great Lakes basin – as reported in the State of the Great Lakes 2022 Report, no new species associated with ballast water have been introduced since 2006.
Leading Lake Erie research
GLERL led a large multi-agency experiment from 2005 to 2007 called the International Field Years on Lake Erie (IFYLE). The focus of this study was harmful algal blooms and hypoxia.
2010s
Great Lakes Restoration Initiative
Since 2010, nearly $5 billion has been invested in the Great Lakes region for restoration efforts through the Great Lakes Restoration Initiative (GLRI). The GLRI is a joint initiative of 16 federal agencies, led by the U.S. EPA, with the goal of restoring Great Lakes ecosystems.
To guide the work conducted under the GLRI, federal agencies created a comprehensive plan that prioritizes restoration and protection activities within five Focus Areas: Toxic Substances and Areas of Concern; Invasive Species; Nonpoint Source Pollution Impacts on Nearshore Health; Habitats and Species; and Foundations for Future Restoration Actions. NOAA has been allocated over $355 million in GLRI funds to accomplish restoration goals by generating ground-breaking science, creating and disseminating data products and services, and restoring critical habitats.
Cooperative Science and Monitoring Initiative (CSMI)
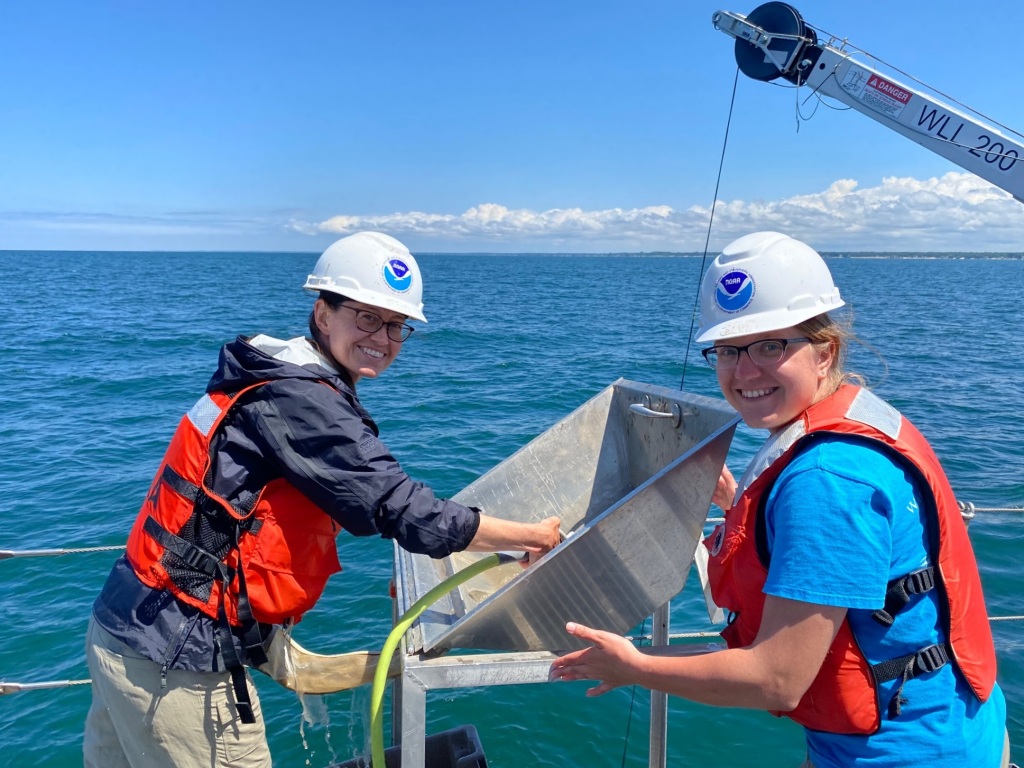
In the 2010s, GLERL became involved in the Cooperative Science and Monitoring Initiative (CSMI), a binational effort instituted under the Science Annex of the 2012 Great Lakes Water Quality Agreement to coordinate science and monitoring activities in one of the five Great Lakes each year. These efforts generate data and information for environmental management agencies. CSMI’s enhanced science and monitoring activities are conducted in response to priorities established by the Lake Partnerships of the Great Lakes Water Quality Agreement Lakewide Management Annex.
Toledo water crisis and resulting HAB research
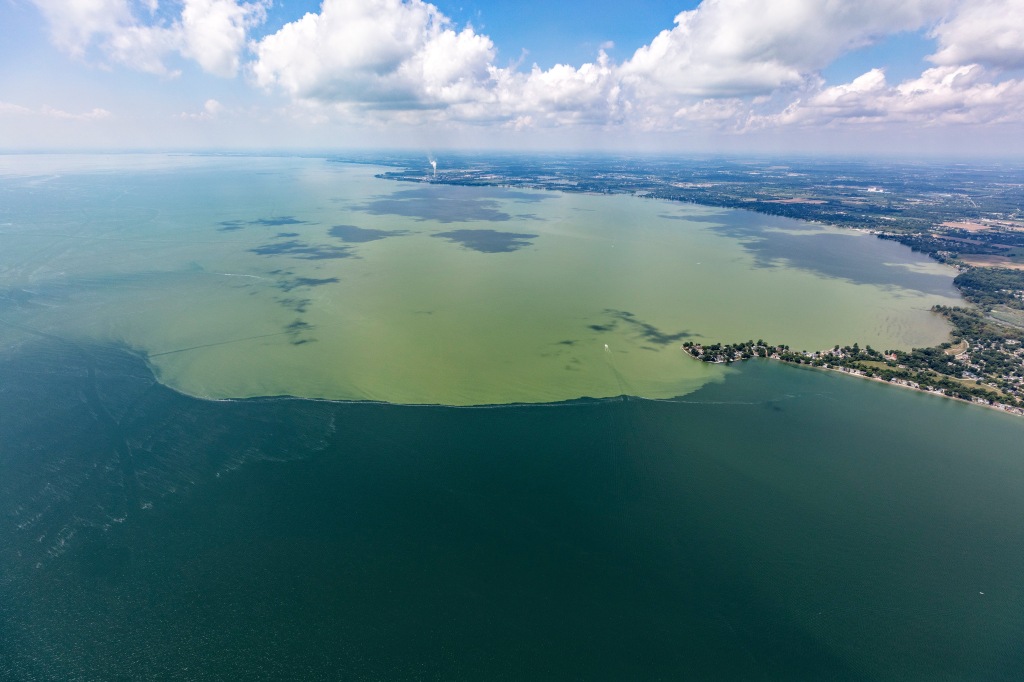
In 2014, Toledo, Ohio officials issued a two-day ban on drinking and cooking with tap water for more than 400,000 residents due to toxins concentrations that exceeded the World Health Organizations guideline level for safe drinking water. These toxins were a result of an algal bloom that was occurring in western Lake Erie. The economic impact of a severe algal bloom season on Lake Erie has been estimated at $65 million. This event served as a wake-up call that harmful algal blooms (HABs) can be incredibly costly, have serious economic impacts, and can pose serious threats to human health, drinking water safety, and water-dependent businesses and activities.
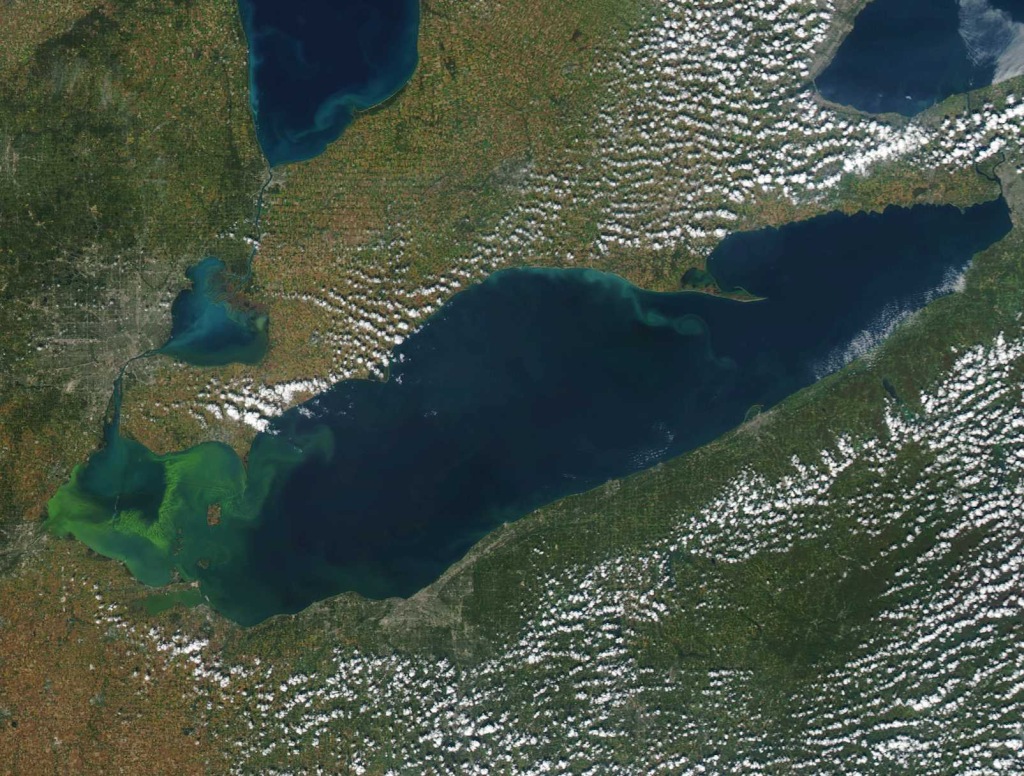
As such, this event underscored the importance of HAB monitoring, forecasting, and research. GLERL’s HABs research program uses an integrated approach to understand the environmental drivers of HABs and hypoxia to predict events. Using satellite images, remote sensing, buoys, a comprehensive monitoring program in Lake Erie, Saginaw Bay, and Lake Huron, and advanced genetic techniques, GLERL researchers work to understand the long and short-term seasonal dynamics of HABs and hypoxia. The data collected is used to inform forecast models used by key Great Lakes stakeholder groups, such as drinking water managers.
GLERL’s Current and Future Directions
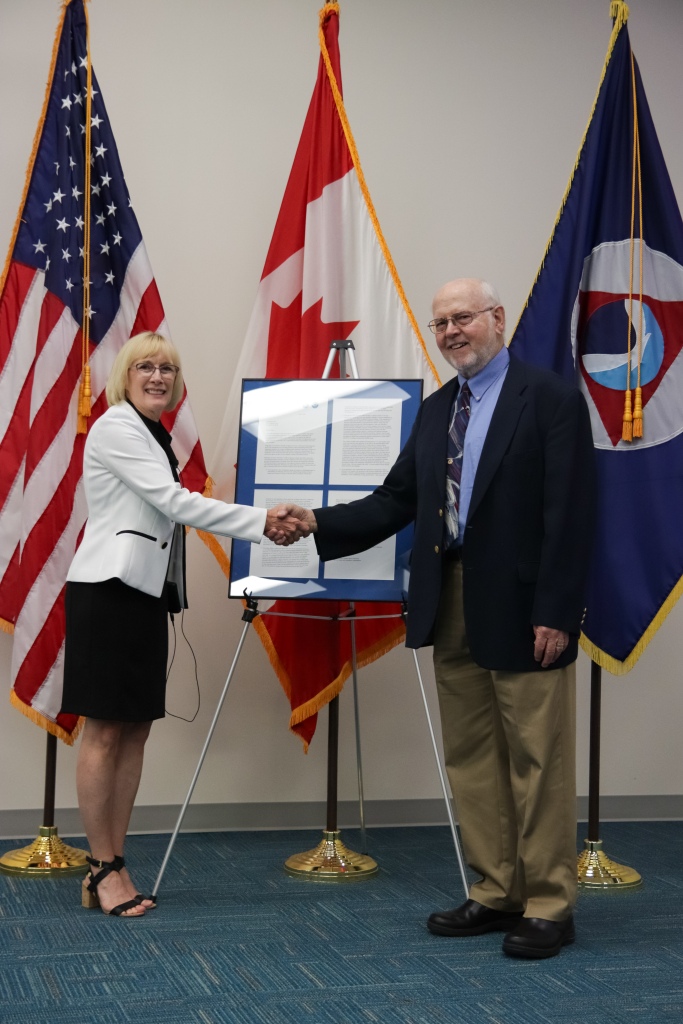
U.S. Coast Guard Great Lakes Center of Expertise for Oil Spill Response and Research
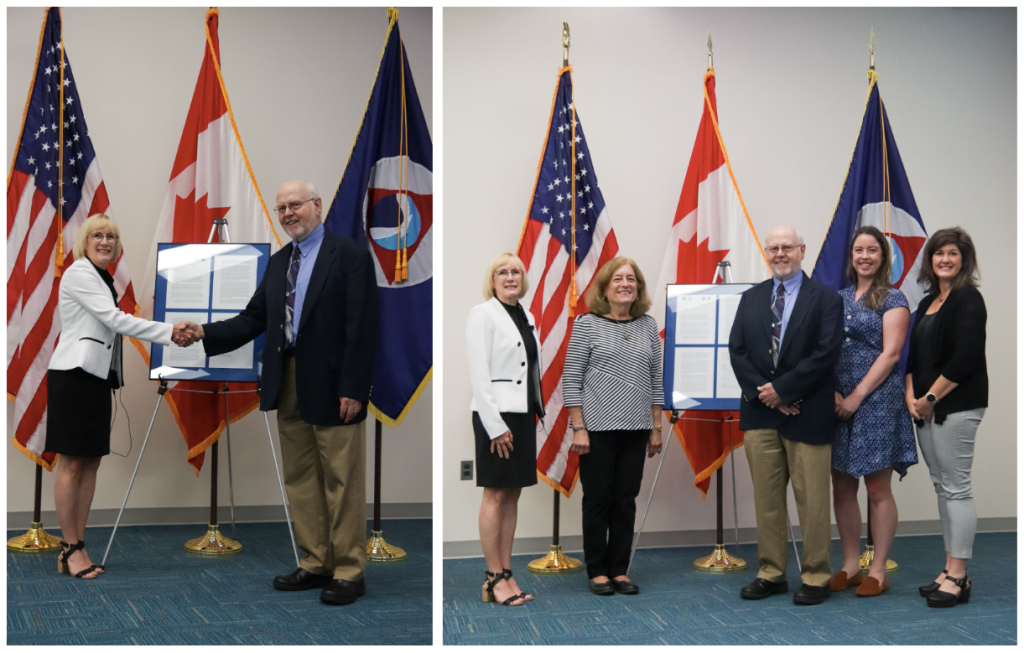
In 2021, GLERL was chosen as one of two worksites for the newly established United States Coast Guard (USCG) Great Lakes Center of Expertise (GLCOE) for Oil Spill Response and Research. GLERL experts are working to evaluate the General NOAA Operational Modeling Environment (GNOME) for the Great Lakes freshwater environment, identifying gaps for tracking oil spills such as freshwater conditions and ice effects, and developing strategies to address these gaps.
GLERL also incorporates its high-resolution Great Lakes Coastal Forecasting System (GLCFS) surface currents forecasts into the GNOME framework to evaluate and improve oil spill trajectories and location tracking to support potential response, rescue, and cleanup.
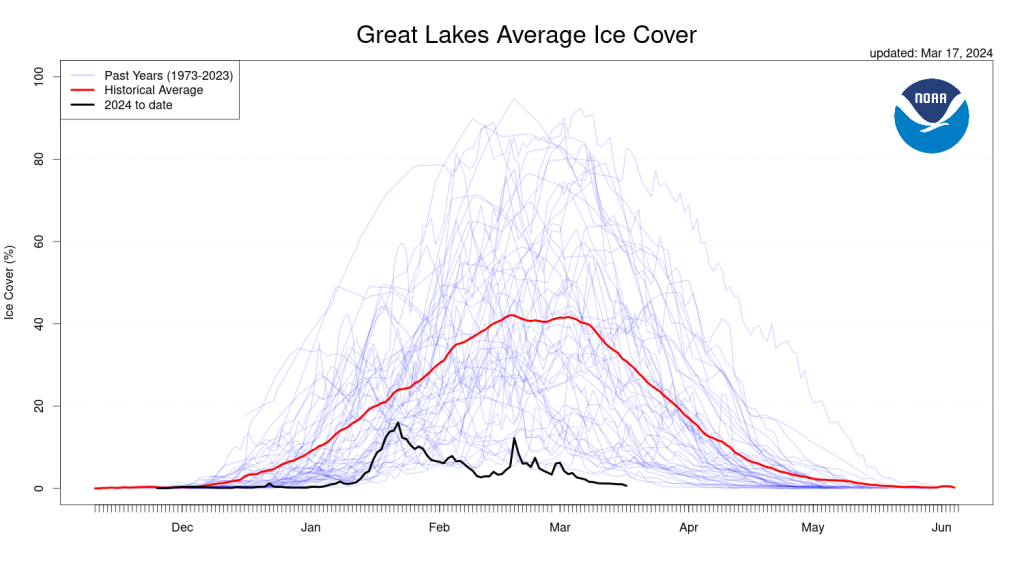
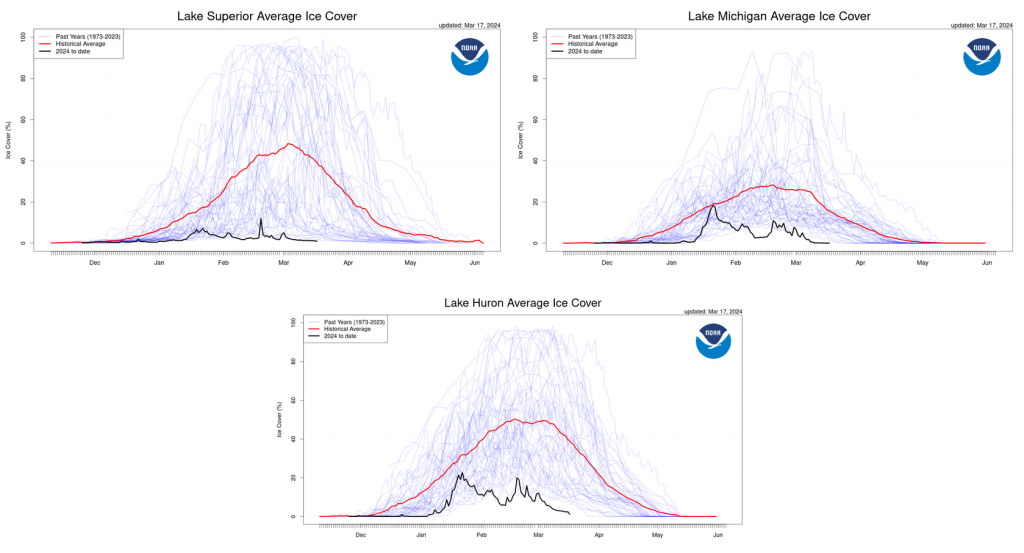
Our research addresses the potential impact of ice cover on oil spill trajectories including identifying efficient tracking for oil under ice, ice breaking, and wave-ice interactions.
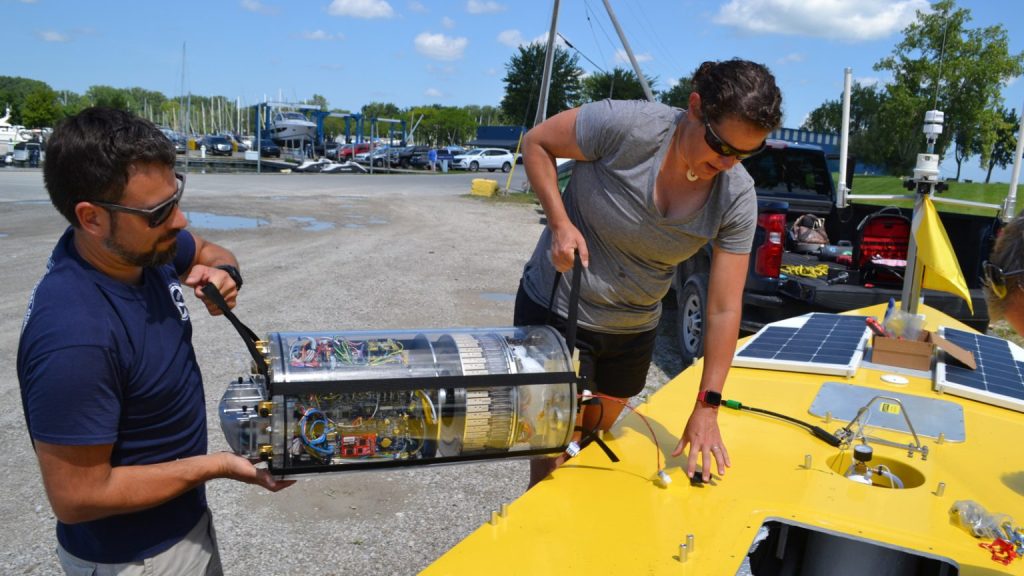
Today’s key research areas
Today, GLERL research is carried out under three integrated science branches: Observing Systems and Advanced Technology, Ecosystem Dynamics, and Integrated Physical and Ecological Modeling and Forecasting. These three branches work together to collect the necessary information to develop and advance predictions of interconnected ecological and human systems in the Great Lakes. Current key research areas:
- Food web changes since the Zebra and Quagga mussel invasion
- Climate change impacts
- Development of coastal forecast systems
- Dissemination of satellite imagery for environmental products development
- Bioavailability of toxic organic chemicals
- Using eDNA and ‘omics to predict impacts of climate change and invasive species on the microbial food web and enhance our ability to predict and monitor HABs