NOAA Great Lakes Environmental Research Laboratory

The latest news and information about NOAA research in and around the Great Lakes


Leave a comment

Q&A with NOAA scientists: Causes and impacts of 2024’s historically low Great Lakes ice cover

Many people have questions about the historically low Great Lakes ice cover this winter, and we’ve got answers! NOAA GLERL’s Bryan Mroczka (Physical Scientist) and Andrea Vander Woude (Integrated Physical and Ecological Modeling and Forecasting Branch Chief) answer the following frequently asked questions regarding the causes and impacts of this year’s low ice cover.

What’s driving the lack of ice? Is El Niño involved somehow?

The long-term trend shows a decline in ice cover in the Great Lakes region over the past several decades. Ice cover has been decreasing by approximately 5 percent per decade, for a 25 percent total decrease between 1973 and 2023. In addition, the length of the Great Lakes ice season has decreased by approximately 27 days on average over the same period.

Annual maximum ice cover on the Great Lakes, 1973-2023.

Factors that drive the lack of ice are climatic variables such as the El Niño-Southern Oscillation (ENSO) along the Equatorial Pacific in addition to other global oceanic oscillations. These atmospheric patterns in the ocean influence weather patterns in the Great Lakes, driving the climatic response of the lakes. Increases in air temperatures are responsible for the lack of ice in addition to the “heat memory” of the lakes as they retain heat from the summer season temperatures. 

While El Niño may have exacerbated the extreme low ice seen this year, the increased frequency of low ice years across the lakes is tied to generally warmer winter conditions, defined by fewer and generally shorter intrusion of arctic air into the region. While much of the Continental U.S. has seen a warming trend during the winter months, the upper Midwest/Great Lakes have seen some of the most dramatic warming.

Color-coded chart showing maximum annual ice cover percentage on the Great Lakes from 1973-2024. Bar colors indicate El Niño strength for each year, ranging from "very strong El Niño" to "El Niño not present"
This graph shows maximum ice concentration every year from 1973-2024, with color-coding to show El Niño strength each year. Note that 2024’s maximum ice cover of 16% is as of mid-February, and is subject to change if ice cover increases later in the season.

An important factor in a season’s ice potential across the Great Lakes is the weather patterns influencing the region during December. December is what we would consider a “priming” month, in which the first arctic air masses cool the lakes and begin the ice generation process within enclosed bays and along the shoreline. Recently, we have seen a multitude of Decembers exhibit above-average temperatures, including significantly above-average temperatures this winter in particular. The lack of early season cold air, and resulting late start to the ice generation season makes later significant gains in ice concentration harder to achieve.

How does the lack of ice impact the Great Lakes ecosystem, as well as towns and cities on the lakes? 

Ice is an important element for the ecosystems, economy, and coastal resilience across the Great Lakes. Ice is a natural part of the Great Lakes yearly cycle and many animal species, from microbial to larger fauna, rely on the ice for protecting young and harboring eggs. The Great Lakes also see most of their significant storms and large wave events during the colder months of late fall through winter. The shorebound ice sheets act as an important buffer against these waves, protecting the coast from erosion and damage to shoreline infrastructure. In years with very low ice, such as this one, the coast becomes more susceptible to the full onslaught of wave energy.
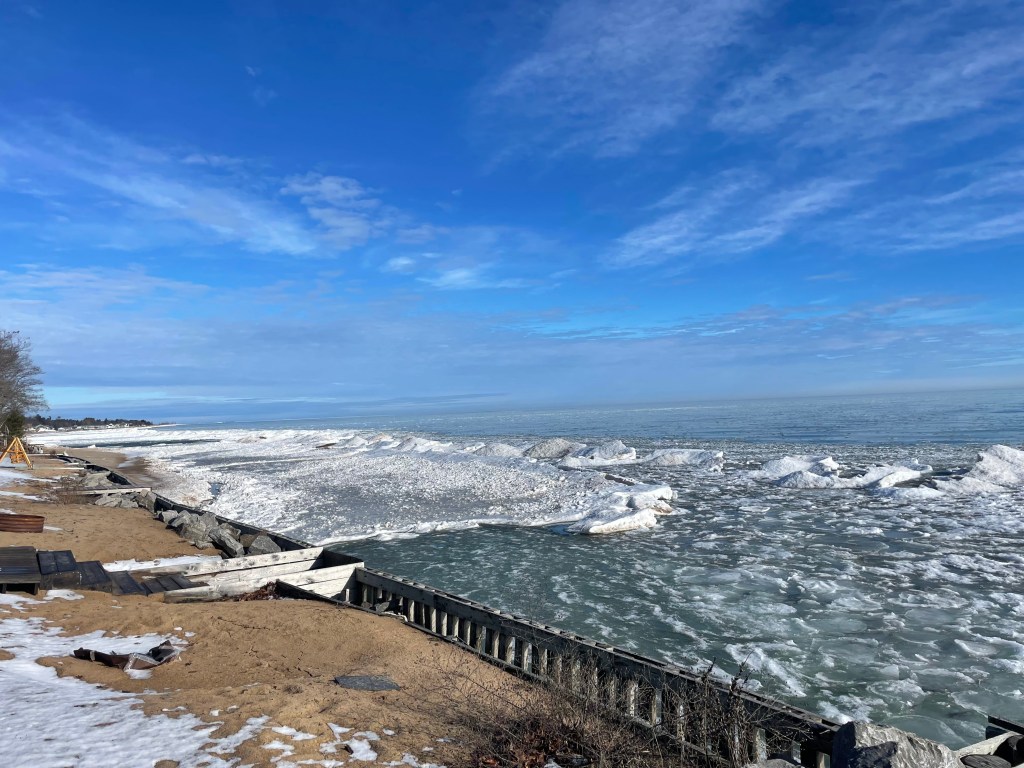
An ice shelf and pieces of floating ice line a residential seawall on Lake Huron on a sunny day.
Ice on the Lake Huron shoreline near Oscoda, MI on January 27, 2024. Credit: Clarice Farina

The economy of the Great Lakes can see negative and positive outcomes from a very low ice year. Two of the more important wintertime recreational sports in the Great Lakes include ice-fishing and snowmobiling. When the ice is scarce and thin, the ability to partake in ice-fishing is significantly reduced both spatially and temporally. When it comes to snowmobiling, warmer winters will generally result in more rain events compared to normal, as well as reduced snow cover and lower quality snow. 

One “silver lining” for the Great Lakes economy that may result from a low ice year, is a boost to the shipping industry. Low ice years are likely to extend the shipping season across the lakes, and may extend the season significantly if the locks are not hampered by significant ice. 

Is there still time for the ice to return before spring?

The ice season in the Great Lakes typically extends until the end of March, and the maximum ice cover for the year comes near the end of February to early March. The clear trend is one of decreasing ice, but it is still too early to determine how this year will ultimately compare to past years and the long term average. 

Winter is not close to being over, and periods of new ice generation are almost certain as we head through the next month. The longer term pattern into early March does suggest that a few bouts of arctic air will reach the Great Lakes, but similar to earlier portions of this winter, there does not appear to be a signal for any long term below average temperature events. The colder air events ahead are more likely to be short-lived (several days), and not long enough for significant gains in ice concentration. It is certainly possible that we’ll see the ice concentrations climb out of the current historic lows before the end of the month, but a major pattern shift (currently not in the forecast) would be required to drive ice concentrations out of below-normal realms for any of the lakes before the spring. 

How do low ice levels impact evaporation, water levels, and lake effect snow?

While Great Lakes water levels are generally lowest in the winter, most of the evaporation from the lakes actually happens in the fall. This is because evaporation is driven by a large difference between the air temperature and the water temperature, which happens in the fall when the air cools down but the water is still holding onto its summer heat. The graphic below illustrates the seasonal cycles that Great Lakes water levels undergo every year.

Graphic showing land in the background and water in the foreground, divided into four panels corresponding with the seasons. Text describes the water level changes throughout the year: Winter low, spring rise, summer peak, and fall decline.

As of right now, we are not seeing any significant impacts to water levels due to the lower ice. Water levels are essentially the same (within one inch) as the values we were seeing at this time last year, and running just a touch above the long term average. The U.S. Army Corps of Engineers is forecasting very little change in water levels for the next 6 months. The lakes are almost ice-free, but we are also not seeing any significant degree or duration of arctic air. Despite the lack of ice, the water temperatures are still cold – just a few degrees above freezing – so the generally small difference in water temperature and air temperature means that evaporation levels are kept in check.

One might assume that the lakes remaining ice-free might increase the amounts of lake effect snow, and this is possible given there is still a steady supply of colder air supportive of driving the lake effect. However, this winter, the lack of cold air arriving over the region has reduced the lake effect snow events, and promoted significant melting between events.

Why do NOAA GLERL’s ice records only go back to 1973?

The early 1970s is when we first had reliable satellite data with which to construct more accurate and complete datasets. Before the satellite era, information during the winter about ice concentration away from the shoreline was very limited. This is why we only use the 51-year dataset for our calculations, as this represents the highest quality data.

Learn more about this year’s low Great Lakes ice

Current and historical ice cover data from NOAA GLERL

NOAA Research: Great Lakes ice cover reaches historic low

Climate.gov: Ice coverage nearly nonexistent across the Great Lakes, as the historical peak approaches

Download images and graphics from this article on our 2024 ice Flickr album


Leave a comment

Lake effect snow: What, why and how?

As fall comes to a close, those who live and work in the Great Lakes region are wondering what weather this winter has in store. An El Niño Advisory is currently in effect, which means El Niño conditions have developed and are expected to continue. So, what does that mean for the Great Lakes? Will we still see lake effect snow?

An El Niño shifts the odds towards warmer, drier weather across the region – but that certainly doesn’t mean no snow! Whether or not there’s an El Niño, lake effect snow events can and do occur in the Great Lakes every year. In fact, we’re already experiencing them this year in places like Buffalo, NY and western Michigan.

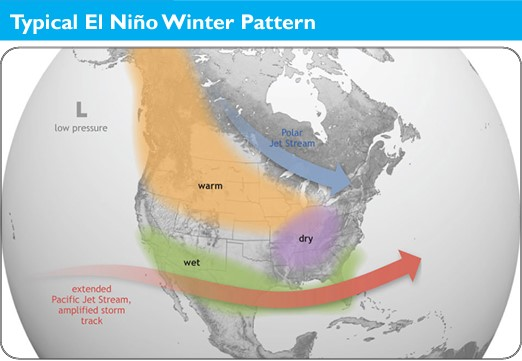
During El Niño winters, the polar jet stream tends to stay to the north of the Great Lakes region, while the Pacific jet stream remains across the southern U.S. With the Great Lakes positioned between the storm tracks, warmer and possibly drier conditions can develop during El Niño events.

What is lake effect snow?

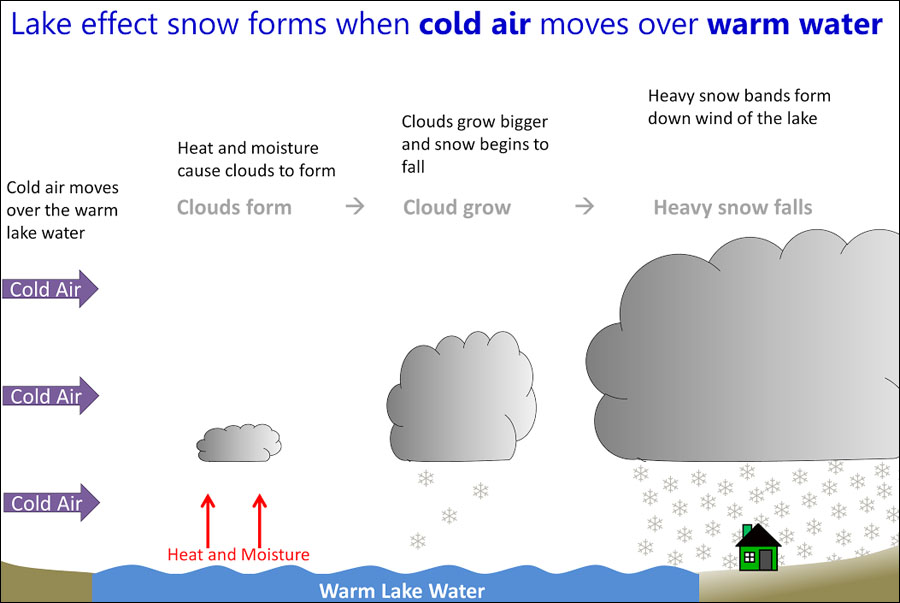
In the Great Lakes region, hazardous winter weather often happens when cold air descends from the Arctic region. Lake effect snow is different from a low pressure snow storm in that it is a much more localized and sometimes very rapid and intense snow event. As a cold, dry air mass moves over the unfrozen and relatively warm waters of the Great Lakes, warmth and moisture from the lakes are transferred into the atmosphere. This moisture then gets dumped downwind as snow.

Graphic via NOAA National Weather Service

Lake Effect Snow Can Be Dangerous

Lake effect snow storms can be very dangerous. For example, 13 people were killed by a storm that took place November 17-19, 2014 in Buffalo, New York. During the storm, more than five  feet of snow fell over areas just east of Buffalo, with mere inches falling just a few miles away to the north. Not only were lives lost, but the storm disrupted travel and transportation, downed trees and damaged roofs, and caused widespread power outages. Improving lake effect snow forecasts is critical because of the many ways lake effect snow conditions affect commerce, recreation, and community safety. 

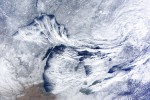
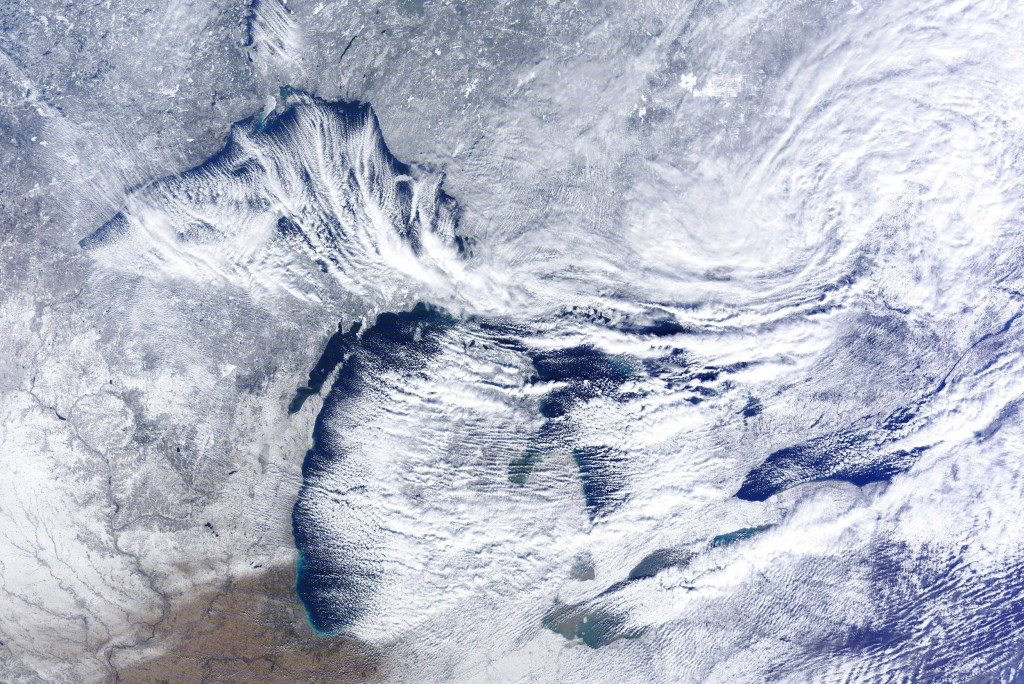
MODIS satellite image of a lake effect snow event in the Great Lakes, caused by extensive evaporation as cold air moves over the relatively warm lakes. November 20, 2014. Credit: NOAA Great Lakes CoastWatch.

Why is lake effect snow so hard to forecast?

There are a number of factors that make lake effect snow forecasting difficult. The widths of lake-effect snowfall bands are usually less than 3 miles — a very small width that makes them difficult to pinpoint in models. The types of field measurements scientists need to make forecasts better are also hard to come by, especially in the winter!  We would like to take frequent lake temperature and lake ice measurements, but that is difficult to do during the winter, as conditions are too rough and dangerous for most research vessels and buoys. (However, NOAA is making progress towards expanding our Great Lakes winter observation capabilities!)

Satellite measurements can also be hard to come by, as the Great Lakes region is notoriously cloudy in the winter. It’s not uncommon to go for over a week without usable imagery.

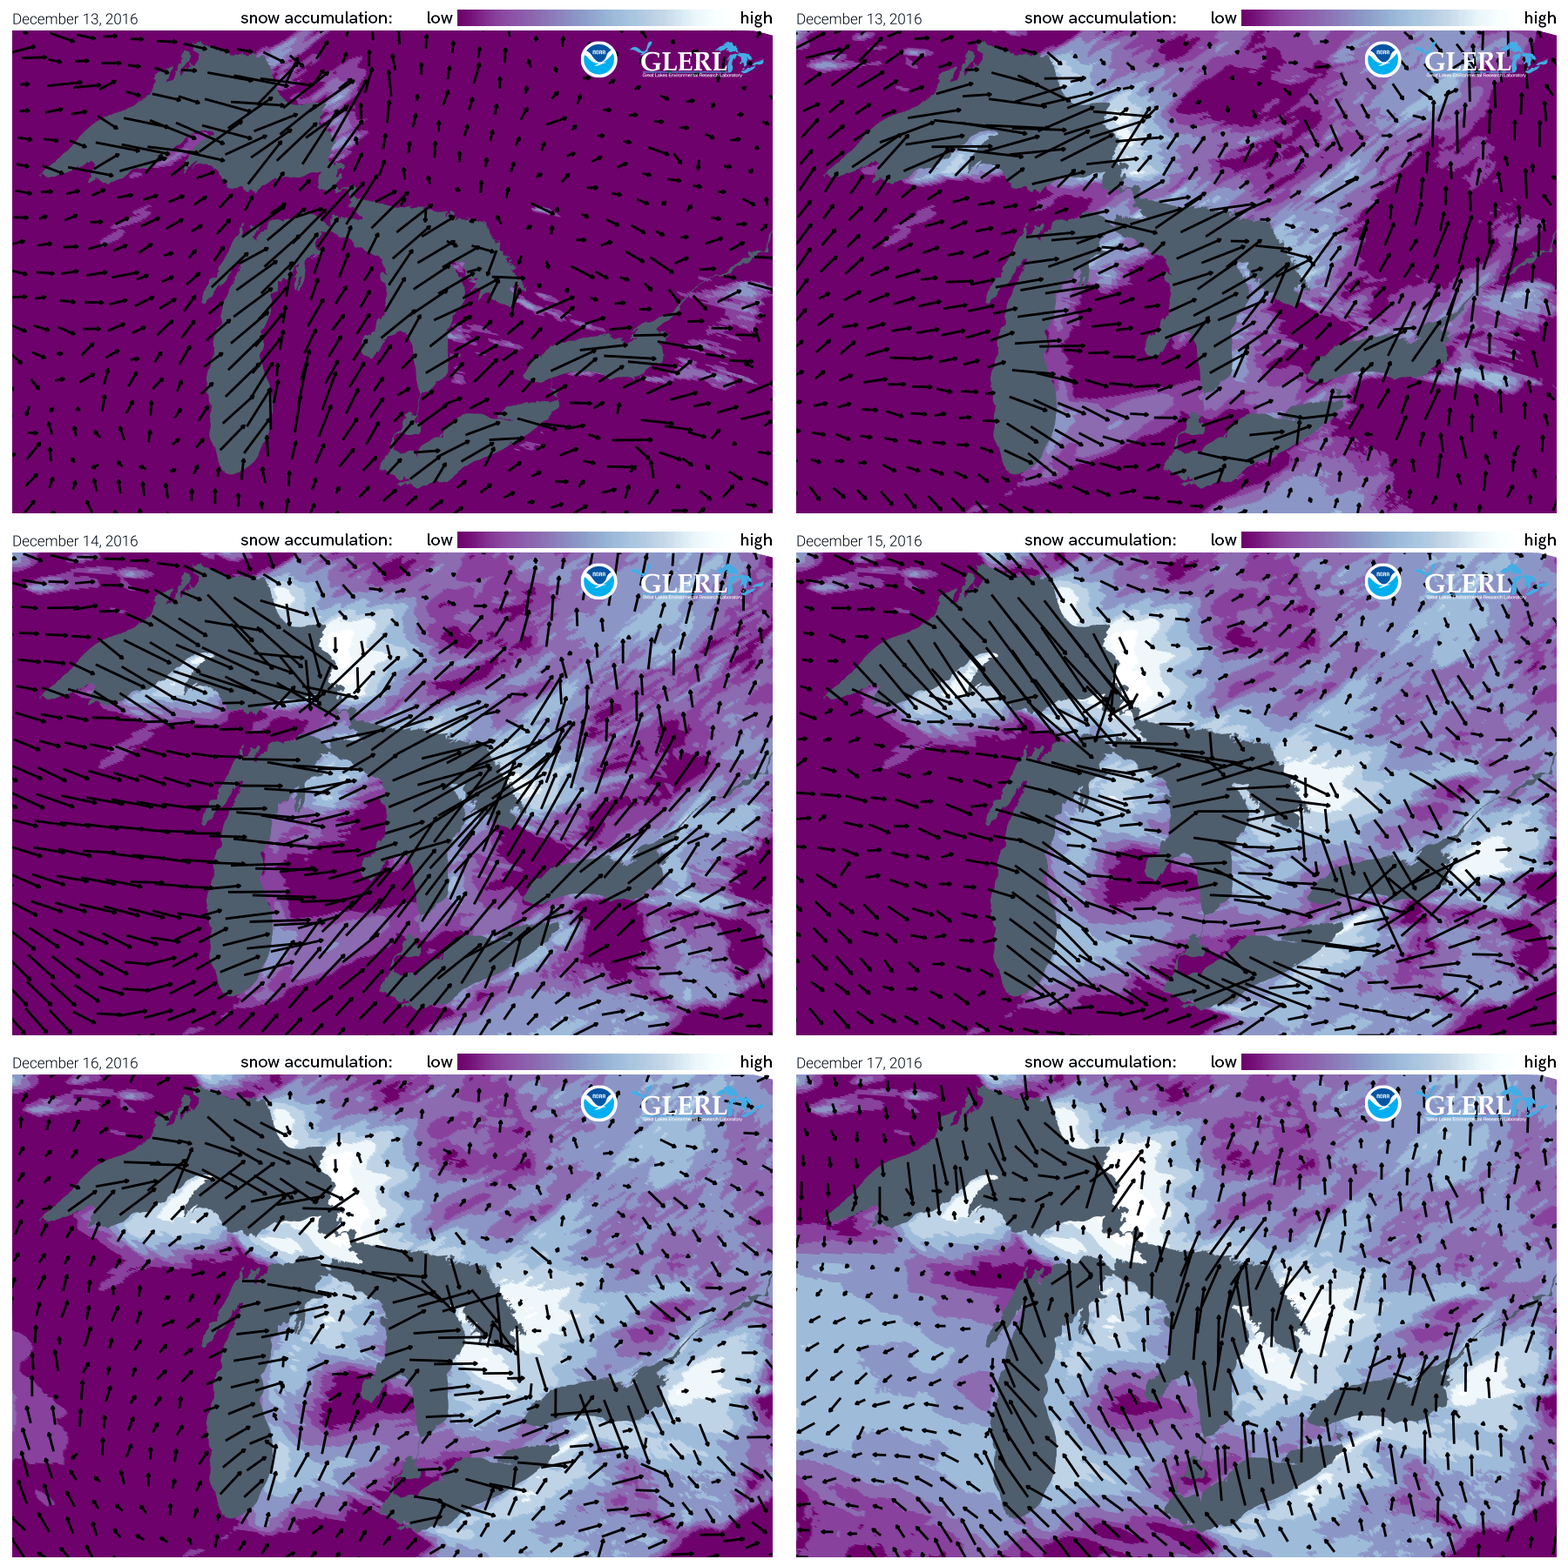
Lake Effect Snow animation: This mid-December 2016 lake effect snow event resulted in extremely heavy snow across Michigan, Ohio, upstate New York as well as the province of Ontario east of Lake Superior and Huron.

NOAA GLERL and CIGLR work to improve lake effect snow forecasting

Currently, NOAA Great Lakes operational models provide guidance for lake effect snow forecasts and scientists at NOAA GLERL and the Cooperative Institute for Great Lakes Research (CIGLR) are conducting studies to improve them. 

They use data from lake effect snow events in the past and compare how a new model performs relative to an existing model.  One way to improve forecast model predictions is through a model coupling approach, or linking two models so that they can communicate with each other. When they are linked, the models can share their outputs with each other and produce a better prediction in the end.

Research published by CIGLR, GLERL and other research partners, “Improvements to lake-effect snow forecasts using a one-way air-lake model coupling approach,” is part of a series of studies (see list below) that help to make lake effect snow forecasts better. This study takes a closer look at how rapid changes in Great Lakes temperatures and ice impact regional atmospheric conditions and lake-effect snow. Rapidly changing Great Lake surface conditions during lake effect snow events are not accounted for in existing operational weather forecast models. The scientists identified a new practical approach for how models communicate that does a better job of capturing rapidly cooling lake temperatures and ice formation. This research can result in improved forecasts of weather and lake conditions. The models connect and work together effectively and yet add very little computational cost. The advantage to this approach in an operational setting is that computational resources can be distributed across multiple systems.

Study model run: This panel of images shows model runs that looks at data from a lake effect snow event from January 2018 with and without the new type of model coupling. The image on the far right labeled Dynamic – Control Jan 06 shows the differences in air temperature (red = warmer, blue = colder) and wind (black arrows) when the models are coupled. The areas in color show how the new model coupling changed the model output considerably and improved the forecast.

Our lake effect snow research continues

Our lake effect modeling research is ongoing, and NOAA GLERL, CIGLR, NOAA NWS Detroit, the NOAA Global Systems Laboratory continue to address the complex challenges and our studies build upon each other to improve modeling of lake-effect snow events. A future focus will be on running the models on a smaller grid scale and continuing to work to improve temperature estimates as both are key to forecasting accuracy. 


Related news articles and blog posts: 

Improving Lake Effect Snow Forecasts

Improving lake effect snow forecasts by making models talk to each other

Related research papers: 

Fujisaki-Manome et al. (2022) Forecasting lake-/sea-effect snowstorms, advancement, and challenges

Fujisaki-Manome et al. (2020) Improvements to lake-effect snow forecasts using a one-way air-lake model coupling approach. 

Anderson et al. (2019) Ice Forecasting in the Next-Generation Great Lakes Operational Forecast System (GLOFS)

Fujisaki-Manome et al. (2017) Turbulent Heat Fluxes during an Extreme Lake-Effect Snow Event

Xue et al. (2016) Improving the Simulation of Large Lakes in Regional Climate Modeling: Two-Way Lake-Atmosphere Coupling with a 3D Hydrodynamic Model of the Great Lakes


Leave a comment

Low ice on the Great Lakes this winter

Ice coverage has reached a record low in the Great Lakes for this time of year. As of February 13, 2023, only 7 percent of these five freshwater lakes was covered in ice. Read the full story on NOAA Research.

This MODIS satellite image from February 12th, 2023 shows below-average ice cover for this time of year on the Great Lakes. Credit: NOAA GLERL / NOAA Great Lakes CoastWatch Node.


Leave a comment

New under-ice observing capabilities could lead to new discoveries in the Great Lakes

***UPDATED DECEMBER 2022***

During the dog days of summer here in the Great Lakes, scientists at NOAA’s Great Lakes Environmental Research Laboratory (GLERL) are already thinking about the ice that will form on the lakes this winter.

This year, NOAA GLERL and a team of federal, university, and industry partners are conducting test deployments of an autonomous underwater vehicle (AUV) in Lake Michigan, with the ultimate goal of using it under lake ice during winter to collect ecological and water quality data. Observations of winter ecology are difficult to obtain compared to observations in the ice-free season, when most fieldwork takes place – which makes this hunt for winter data especially important. 

In the world of Great Lakes research, the start of winter traditionally signals the end of fieldwork for the year. Buoys come out of the water, and research vessels – which aren’t designed for use in ice-covered waters – are docked for the season. Scientists get to work analyzing new data from the previous field season and tuning up field equipment for a fresh start in the spring. This break leads to a several-month gap in most of GLERL’s field data, but this project aims to fill that gap using the high-tech SAAB Sabertooth AUV. 

Video by Great Lakes Outreach Media.

One underwater robot, many important jobs

One of the AUV’s main tasks will be to collect water quality data, benthic (lake bottom) data, and fish and zooplankton observations. These observations will be collected using an acoustic imaging system, and will contribute to our understanding of important wintertime ecological processes in the Great Lakes. While summer is widely considered to be the peak time of year for biological productivity, biological processes still occur during the winter and are understudied in the Great Lakes. NOAA GLERL’s winter observations may even lead to unexpected discoveries, as new GLERL data suggest that some Great Lakes biological processes may actually accelerate during the winter months. Ice cover is seen as a key variable in the regulation of biological processes in the lakes during winter. Enhancing our understanding of these processes is particularly important as climate change may have implications for the extent, thickness, and duration of seasonal ice cover. 

The Saab Sabertooth is an autonomous underwater vehicle (AUV) that NOAA GLERL will operate under ice during winter in the Great Lakes.

The AUV also will characterize winter distributions of prey fish using a multi-frequency echosounder. Spawning in prey fish species like bloater also take place during winter, in turn affecting predator stocks (like lake trout) that help underpin a 7 billion-dollar annual Great Lakes fishery. Additionally, the AUV will contribute valuable data on the distribution of invasive mussels to NOAA GLERL’s 25-year ecological monitoring program. The AUV will map the locations of invasive mussel reefs on the lake floor using sonar technology and high-resolution imagery.

World-class technology in the Great Lakes

The SAAB Sabertooth AUV is no average piece of fieldwork equipment; it’s among the most advanced and complex underwater vehicles in the world. Navigation is one of the biggest challenges AUVs face, since GPS signals are unavailable underwater. This AUV contains an Inertial Navigation System, which keeps track of the vehicle’s movements with extreme precision. Based on its known deployment location, the vehicle uses this navigation system to calculate its exact location throughout its mission with minimal error. When within range, acoustic beacons anchored nearby in the lake are also used to confirm the AUV’s location.

Acoustic beacon is deployed in Lake Michigan for AUV navigation system updates. Brad Hibbard dials in a highly accurate beacon location.  

In addition to the AUV itself, this effort also includes the development of a fully integrated docking station that allows the vehicle to recharge its battery and transfer the data it’s collected during its winter excursion. The vehicle’s ability to safely dock, charge its battery, and transmit data to scientists is a critical component in its ability to function under ice without human help.

AUV docking station built by Hibbard Inshore. The dock allows vehicle recharging and data transfer through a Sonardyne BlueComm optical communications system. Hibbard and Saab used Sonardyne acoustic beacons to enable autonomous docking.

***

DECEMBER 2022 UPDATE

The most recent phase of this project, conducted in December 2022 at the beginning of meteorological winter, tested the AUV’s docking station and charging capabilities for the first time. The highly successful field trials achieved several goals:

  • The AUV autonomously navigated through the Muskegon Channel and out into Lake Michigan, where it successfully collected ecological data and mapped the lake floor.
  • Back in the channel, the AUV autonomously docked itself, using Sonardyne acoustic beacons to confirm its location.
  • Once docked, the AUV transferred the data it had collected and successfully recharged its battery from a Teledyne Energy Systems Subsea Supercharger® hydrogen fuel cell. As a truly groundbreaking outing, this field trial was the first time the Saab AUV has ever been charged underwater using a fuel cell power source.

So, where will all this new data go? The AUV’s data will ultimately be added to GLERL’s Realtime Coastal Observation Network (ReCON).

Lowering the Teledyne Energy System’s Subsea Supercharger® hydrogen fuel cell into the water. The fuel cell was used to recharge Hibbard Inshore’s Saab AUV internal batteries.
After several days of testing the docking and
navigation capabilities, the AUV headed out into
Lake Michigan for a trial to collect ecosystem data.

***

Smooth sailing beneath the surface

The large size of the AUV provides ample space, flotation, and electrical resources for simultaneously carrying a large suite of sensors that make multitasking a breeze for this high-tech vehicle. The various sensors work together to ensure the vehicle stays upright, avoids collisions with boats, and doesn’t accidentally hit the bottom of the lake. Plus, robust propellers allow the AUV to make precise turns and hover at a fixed depth, making it much easier to maneuver than its torpedo-shaped cousins.

Preparing this AUV for deployment is no small task. Vehicle setup was completed by the Hibbard Inshore and Saab team over several days.

When it’s not in the Great Lakes helping NOAA with environmental research, this vehicle can usually be found performing tunnel inspections at hydroelectric power facilities around the world – including locations like California, South Korea, and Turkey. The AUV’s ability to navigate through these tunnels allows them to be inspected without being drained, saving considerable time and money. Just as it navigates through these enclosed tunnels, this impressive underwater robot could soon be navigating its way under Great Lakes ice cover.

NOAA GLERL’s partners on this project include Hibbard Inshore, Saab Dynamics AB, Teledyne Energy Systems, the Cooperative Institute for Great Lakes Research (CIGLR), and the United States Geological Survey (USGS).

NOAA Disclaimer: This publication does not constitute an endorsement of any commercial product or intend to be an opinion beyond scientific or other results obtained by NOAA.


9 Comments

Looking back: The ups and downs of Great Lakes ice cover in 2021

Ice formations cover a pier on the Lake Michigan shoreline in Holland, MI. February 27, 2021. Credit: Clarice Farina.

It’s no secret that the Great Lakes had a wild ride in terms of ice cover this past winter. From a slow start that led to near-record low ice cover in January, to the sudden widespread freeze just a few weeks later, here’s a look back at how ice cover on the lakes has fluctuated during the 2020-2021 ice season.

As we highlighted in our last blog post on historic ice data, January 2021 had the second-lowest overall Great Lakes ice cover on record since 1973 (with the very lowest being January 2002). For all five individual lakes, January 2021 was in the top five lowest ice-cover Januarys since 1973.

This graph shows average Great Lakes ice cover for the month of January every year from 1973 to 2021, organized by lowest ice cover (far left) to highest ice cover (far right). Credit: NOAA GLERL.

Starting out at 10.65% on February 1st, ice cover rose dramatically over the next three weeks with the region’s extreme cold weather. Growing quickly and steadily, total Great Lakes ice cover finally topped out at 45.84% on February 19th. But with air temperatures warming back up shortly afterwards, this spike was short-lived. Within a week it was back down to around 20% and continued to taper off, falling below 1% on April 3rd and reaching 0.1% on April 20.

This graph shows Great Lakes ice cover in 2021 (black line) compared to the historical average ice cover from 1973-2020 (red line). Credit: NOAA GLERL.

This Winter vs. The Long-Term Average

While all five lakes were far below their January average, each one did something a little different during February, when compared to its 1973-2020 average. The following graphs show this winter’s ice cover (black line) vs. the 1973-2020 average (red line) for each lake.⁣

Lake Erie ice cover jumped dramatically up to 81% in the second week of February, well above its average seasonal peak of around 65%. It stayed above 75% for about two weeks until falling back down below its average at the beginning of March.


Lake Michigan ice cover increased steadily throughout February, with its highest percentage being 33% on February 18th — only briefly staying above its average for that time period. It dropped off quickly the following week, then decreased gradually throughout March.

Lake Superior spent about a week in mid-February above its average ice cover for those days, peaking at about 51% on February 19th. Similar to Lake Michigan, it only stayed above its average for a short interval before rapidly falling back down under 20%.

Lake Ontario ice cover took a while to ramp up, staying below 10% until mid-February. It reached maximum ice cover on February 18th, topping out at about 21% – slightly higher than its average for that day.


Lake Huron was the only lake that did not reach above-average ice cover for the entire winter. Its peak ice cover was 48% on February 20th, which was about the same as its average for that time of year.

Melting into Spring

Throughout March, ice cover on all five lakes continued to decrease steadily, with the exception of a spike in ice cover around the second week of the month likely due to fluctuations in air temperature. For Lakes Erie and Ontario, this short-lived jump was enough to get them back up near their average early March ice cover for a few days. 

As for the timing of each lake’s peak 2021 ice cover compared with the average, Lakes Erie, Michigan, Huron, and Ontario all peaked later than their average, while Lake Superior is the only one that peaked earlier than its average.

Ice covers the Lake Huron shoreline in Oscoda, MI on February 15, 2021. Credit: G. Farina, NOAA GLERL.

This winter’s maximum seasonal ice cover of 45.8% is just 7.5% less than the long-term average of 53.3%. While it’s below the average, it’s still more than double the 2020 seasonal maximum of 19.5% ice cover, but is just over half the 2019 seasonal maximum of 80.9%. With so much year-to-year variability, forecasting ice cover each year can be incredibly difficult. NOAA GLERL’s experimental ice forecast, updated in mid-February, predicted Great Lakes ice cover in 2021 to peak at 38% – not too far off from what it really was. NOAA GLERL continues to analyze both current and historical data to refine the ice forecast model, working to actively improve our experimental Great Lakes ice forecast each year.

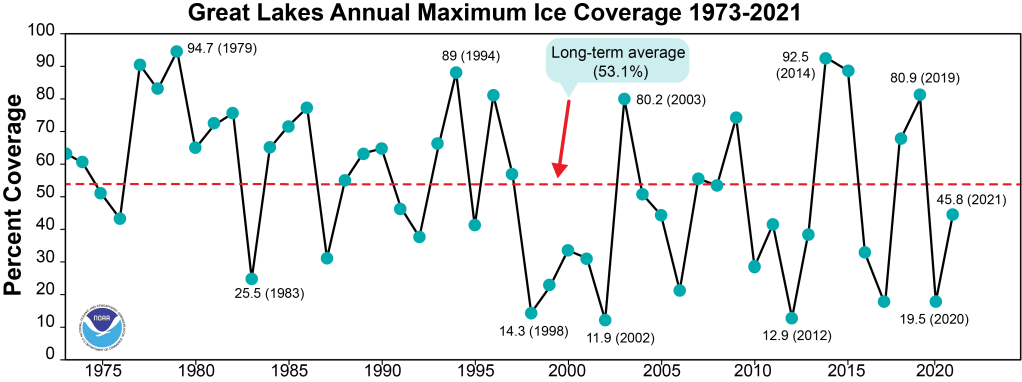
This graph shows annual maximum ice cover on the Great Lakes each year from 1973 to 2021. Credit: NOAA GLERL.

For more on NOAA GLERL’s Great Lakes ice cover research and forecasting, visit our ice homepage here: https://go.usa.gov/xsRnM⁣

⁣Plus, access these graphs plus more Great Lakes CoastWatch graphs & data here: https://go.usa.gov/xsRnt⁣

Flat, jagged pieces of ice float in Lake Huron near Oscoda, MI on February 15, 2021. Credit: G. Farina, NOAA GLERL.


2 Comments

Five decades of Great Lakes ice cover data – and where to find it

Understanding the major effects of ice on the Great Lakes is crucial. Ice cover impacts a range of societal benefits provided by the lakes, from hydropower generation to commercial shipping to the fishing industry. The amount of ice cover varies from year to year, as well as how long it remains on the lakes. With almost five full decades of ice data to look at, GLERL scientists are observing long-term changes in ice cover as a result of climate change. Studying, monitoring, and predicting ice coverage on the Great Lakes plays an important role in determining climate patterns, lake water levels, water movement patterns, water temperature structure, and spring plankton blooms.

Maximum ice cover on the Great Lakes every year from 1973 to 2018. Credit: NOAA GLERL.

NOAA GLERL has been exploring the relationships between ice cover, lake thermal structure, and regional climate for over 30 years through the use of historical model simulations and observations of ice cover, surface water temperature, and other variables. Weekly ice cover imaging products produced by the Canadian Ice Service (CIS) started in 1973. Beginning in 1989, the U.S. National Ice Center (NIC) produced Great Lakes ice cover charts that combined both Canadian and U.S. satellite imagery. Today, these products are downloaded and processed at GLERL by our CoastWatch program, a nationwide NOAA program within which GLERL functions as the Great Lakes regional node. In this capacity, GLERL uses near real-time satellite data to produce and deliver products that support environmental decision-making and ongoing research. While the Great Lakes CoastWatch Program is a great resource for near real-time ice cover data, historical data is just as important – and that’s where GLERL’s Great Lakes Ice Cover Database comes in. Originally archived by GLERL through the National Snow & Ice Data Center, the Great Lakes Ice Cover Database houses data that dates back to 1973 and continues to be updated daily during the ice season every year.

Ice caves on Lake Michigan’s Glen Haven beach in 2005. Credit: National Parks Service.

Even though the CIS and NIC are the ones who actually collect Great Lakes ice cover data, GLERL plays the important role of re-processing this ice data into more accessible file formats, making it readily usable to anyone who needs it. Agencies and organizations that have used ice cover data from GLERL in the past include the NASA Earth Observatory, U.S. Army Corps of Engineers, U.S. Coast Guard, and National Geographic. Types of data requested might include historic minimum and maximum ice coverage for certain regions or lakes, or dates of the first and last ice cover in a region from year to year. This information can be helpful for managers in industries like energy production and commercial shipping.

This graph shows annual maximum ice coverage on the Great Lakes every year from 1973 to 2020. The red dashed line marks the long-term average maximum ice cover of 53.3%. Credit: NOAA GLERL.

GLERL scientists can also use this historic ice cover data to analyze how current ice cover conditions compare with previous years. For example, here’s how the ice cover during January 2021 stacks up against data for past Januarys:

  • Lake Michigan and the five-lake average had their second lowest January ice cover (with January 2002 being the first lowest).
  • The other lakes are all in the top five lowest ice cover for the month of January.
  • Six out of ten of the Januarys with the lowest ice cover have occurred during the last decade for the five-lake average (though 2014 was fourth highest January ice cover).
This graph shows average Great Lakes ice cover for the month of January every year from 1973 to 2021, organized by lowest ice cover (far left) to highest ice cover (far right). Credit: NOAA GLERL.

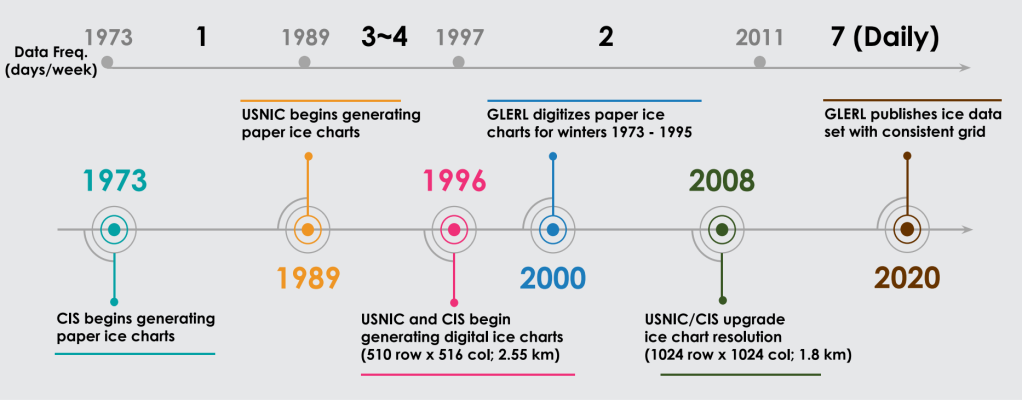
GLERL is also working to make this data more user-friendly for anyone looking to utilize it. This recent paper from GLERL and the Cooperative Institute for Great Lakes Research (CIGLR) describes the scientists’ efforts to standardize two existing formats of historic ice cover data. The authors explain that “technology has improved and the needs of users have evolved, so Great Lakes ice cover datasets have been upgraded several times in both spatial and temporal resolutions.” The paper documents the steps the authors took to reprocess the data in order to make it more consistent and accessible, which ultimately makes it easier for users to study long-term trends.

Timeline of ice chart evolution and frequency, from the research paper described above (Yang et al 2020). Credit: Ting-Yi Yang, Cooperative Institute for Great Lakes Research.

Whether you’re looking for decades of Great Lakes ice data or just a few days, GLERL’s got you covered! Looking for more Great Lakes ice cover information? Visit our ice cover homepage here.

MODIS satellite image of ice cover on the Great Lakes, March 16, 2014. Credit: NOAA Great Lakes CoastWatch.


Leave a comment

Lake effect snow: What, why and how?

Winter is nearly here — and those who live and work in the Great Lakes region are already wondering what the winter of 2021 has in store. Early indications suggest a La Niña winter pattern, which shifts the odds towards cooler, wetter weather with more ice cover. 

More snow and ice can mean more fun, and can be great for winter sports like ice fishing, snowmobiling and skiing. Unfortunately, it can also mean severe weather events involving ice and snow. In the Great Lakes region, snow comes via the usual low pressure systems, but we also can get lake effect snow. 

Average location of the jet stream and typical temperature and precipitation impacts during La Niña winter over North America. Map by Fiona Martin for NOAA Climate.gov.

What is lake effect snow?

In the Great Lakes region, hazardous winter weather often happens when cold air descends from the Arctic region. Lake effect snow is different from a low pressure snow storm in that it is a much more localized and sometimes very rapid and intense snow event. As a cold, dry air mass moves over the unfrozen and relatively warm waters of the Great Lakes, warmth and moisture from the lakes are transferred into the atmosphere. This moisture then gets dumped downwind as snow.

Lake Effect Snow Can Be Dangerous

Lake effect snow storms can be very dangerous. For example, 13 people were killed by a storm that took place November 17-19, 2014 in Buffalo, New York. During the storm, more than five  feet of snow fell over areas just east of Buffalo, with mere inches falling just a few miles away to the north. Not only were lives lost, but the storm disrupted travel and transportation, downed trees and damaged roofs, and caused widespread power outages. Improving  lake effect snow forecasts is critical because of the many ways lake effect snow conditions affect commerce, recreation, and community safety.

Lake Effect Snow animation: Mid-December 2016 The lake effect snow EVENT resulted in extremely heavy snow across Michigan, Ohio, upstate New York as well as the province of Ontario east of Lake Superior and Huron.

Why is lake effect snow so hard to forecast?

There are a number of factors that make lake effect snow forecasting difficult. The widths of lake-effect snowfall bands are usually less than 3 miles — a very small width that makes them difficult to pinpoint in models. The types of field measurements scientists need to make forecasts better are also hard to come by, especially in the winter!  We would like to take frequent lake temperature and lake ice measurements but that is currently not possible to do during the winter, as conditions are too rough and dangerous for research vessels and buoys. Satellite measurements can also be hard to come by. The Great Lakes region is notoriously cloudy in the winter –  it’s not uncommon to go for over a week without usable imagery. 

MODIS satellite image of a lake effect snow event in the Great Lakes, caused by extensive evaporation as cold air moves over the relatively warm lakes. November 20, 2014. Credit: NOAA Great Lakes CoastWatch.

GLERL and CIGLR work to improve lake effect snow forecasting

Currently, NOAA Great Lakes operational models provide guidance for lake effect snow forecasts and scientists at NOAA GLERL and CIGLR are conducting studies to improve them. 

They use data from lake effect snow events in the past and compare how a new model performs relative to an existing model.  One way to improve forecast model predictions is through a model coupling approach, or linking two models so that they can communicate with each other. When they are linked, the models can share their outputs with each other and produce a better prediction in the end. 

Our lake effect snow research continues

Our lake effect modeling research is ongoing, and GLERL, CIGLR, NWS Detroit, the NOAA Global Systems Laboratory continue to address the complex challenges and and our studies build upon each other to improve modeling of lake-effect snow events. A new focus will be on running the models on a smaller grid scale and continuing to work to improve temperature estimates as both are key to forecasting accuracy.

A recent study, published by CIGLR and GLERL and other research partners, Improvements to lake-effect snow forecasts using a one-way air-lake model coupling approach,” is the latest in a recent series of studies* (see list below) that help to make lake effect snow forecasts better. This study takes a closer look at how rapid changes in Great Lakes temperatures and ice impact regional atmospheric conditions and lake-effect snow. Rapidly changing Great Lake surface conditions during lake effect snow events are not accounted for in existing operational weather forecast models. The scientists identified a new practical approach for how models communicate that does a better job of capturing rapidly cooling lake temperatures and ice formation. This research can result in improved forecasts of weather and lake conditions. The models connect and work together effectively and yet add very little computational cost. The advantage to this approach in an operational setting is that computational resources can be distributed across multiple systems.

Study model run: This panel of images shows model runs that looks at data from a lake effect snow event from January 2018 with and without the new type of model coupling. The image on the far right labeled Dynamic – Control Jan 06 shows the differences in air temperature (red = warmer, blue = colder) and wind (black arrows) when the models are coupled. The areas in color show how the new model coupling changed the model output considerably and improved the forecast.

Related news articles and blog posts:

From the CIGLR Winter 2020 eNewsletter – Improving Lake Effect Snow Forecasts

NOAA Research News, April 2019 NOAA research yields better lake-effect snow forecasts

NOAA GLERL Blog, 2018 – Improving lake effect snow forecasts by making models talk to each other

Related research papers: 

Fujisaki-Manome et al. (2020) Improvements to lake-effect snow forecasts using a one-way air-lake model coupling approach. 

Anderson et al. (2019) Ice Forecasting in the Next-Generation Great LakesOperational Forecast System (GLOFS) 

Fujisaki-Manome et al. (2017) Turbulent Heat Fluxes during an Extreme Lake-Effect Snow Event

Xue et al. (2016) Improving the Simulation of Large Lakes in Regional Climate Modeling: Two-Way Lake–Atmosphere Coupling with a 3D Hydrodynamic Model of the Great Lakes


Leave a comment

Great Lakes in winter: Water levels and ice cover

The Great Lakes, along with their connecting waterways and watersheds, make up the largest lake system on the planet—more than 20% of the world’s surface freshwater! Water levels on the lakes change in response to a number of factors, and these changes can happen quickly. Changing water levels can have both positive and negative impacts on shipping, fisheries, tourism, and coastal infrastructure like roads, piers, and wetlands.

Currently, water levels on all of the Great Lakes are above their monthly averages, and have been developing since the spring of 2013, when a record-setting two-year rise in water levels began on the upper Great Lakes. Extreme conditions in spring of 2017 produced flooding and widespread damage at the downstream end of the basin—Lake Ontario and the St. Lawrence River. In case you missed it, check out our infographic on this flooding event.

So, what’s happening now that it’s winter?

As we entered the late fall-early winter of 2017-2018, a warm weather pattern had forecasters looking toward a fairly warm winter. However, in late December, the conditions changed and a much colder than normal weather pattern took many folks living in the Great Lakes by surprise. Much like how water levels can change quickly in the Great Lakes, so can ice cover. Due to frigid air temperatures, between December 20 and January 7, total ice cover on the lakes jumped 26.3%. Lake Erie alone jumped up to nearly 90%!


After January 7th, ice coverage dropped a bit as the air temperatures warmed, then rose again as temperatures went back down, showing again how vulnerable the lakes are to even the slightest changes. Compare where we are now to where we were 2 years ago at this time, and you’ll easily see how variable seasonal ice cover can be in the Great Lakes.

Image depicting Great Lakes total ice cover on on January 15, 2018, compared to 2017 and 2016.

What’s the outlook for ice and water levels?

Below, you’ll find what GLERL researchers expect to see for ice cover this winter, as well as the U.S. Army Corps’ water levels forecast into Spring 2018. Be sure to read further to find out more about the science that goes into these predictions!

—GLERL’s 2018 Seasonal Ice Cover Projection for the Great Lakes—

On 1/3/2018, NOAA’s Great Lakes Environmental Research Laboratory updated the maximum 2018 Great Lakes basinwide ice cover projection to 60%. The long-term average is 55%. The updated forecast reflects changes in teleconnection patterns (large air masses that determine our regional weather) since early December 2017—movement from a strong to a weak La Nina, a negative to a positive Pacific Decadal Oscillation, and a positive to a negative North Atlantic Oscillation. These patterns combine to create colder than average conditions for the Great Lakes.

—Water Levels forecast into spring 2018—

According to the most recent weekly water level update from the U.S. Army Corps, water levels for all of the Great Lakes continue to be above monthly average levels and above last year’s levels at this time. All of the lakes have declined in the last month.  Note that ice developing in the channels and on the lake surface can cause large changes in daily levels during the winter, especially for Lake St. Clair. Over the next month, Lake Superior and Lake Michigan-Huron are expected to continue their seasonal decline. Lake St.Clair, Lake Erie, Lake Ontario are expected to begin their seasonal rise.


More information on water levels and ice cover forecasting

How are water levels predicted in the Great Lakes?

Forecasts of Great Lakes monthly-average water levels are based on computer models, including some from NOAA GLERL, along with more than 150 years of data from past weather and water level conditions. The official 6-month forecast is produced each month through a binational partnership between the U.S. Army Corps of Engineers and Environment and Climate Change Canada.

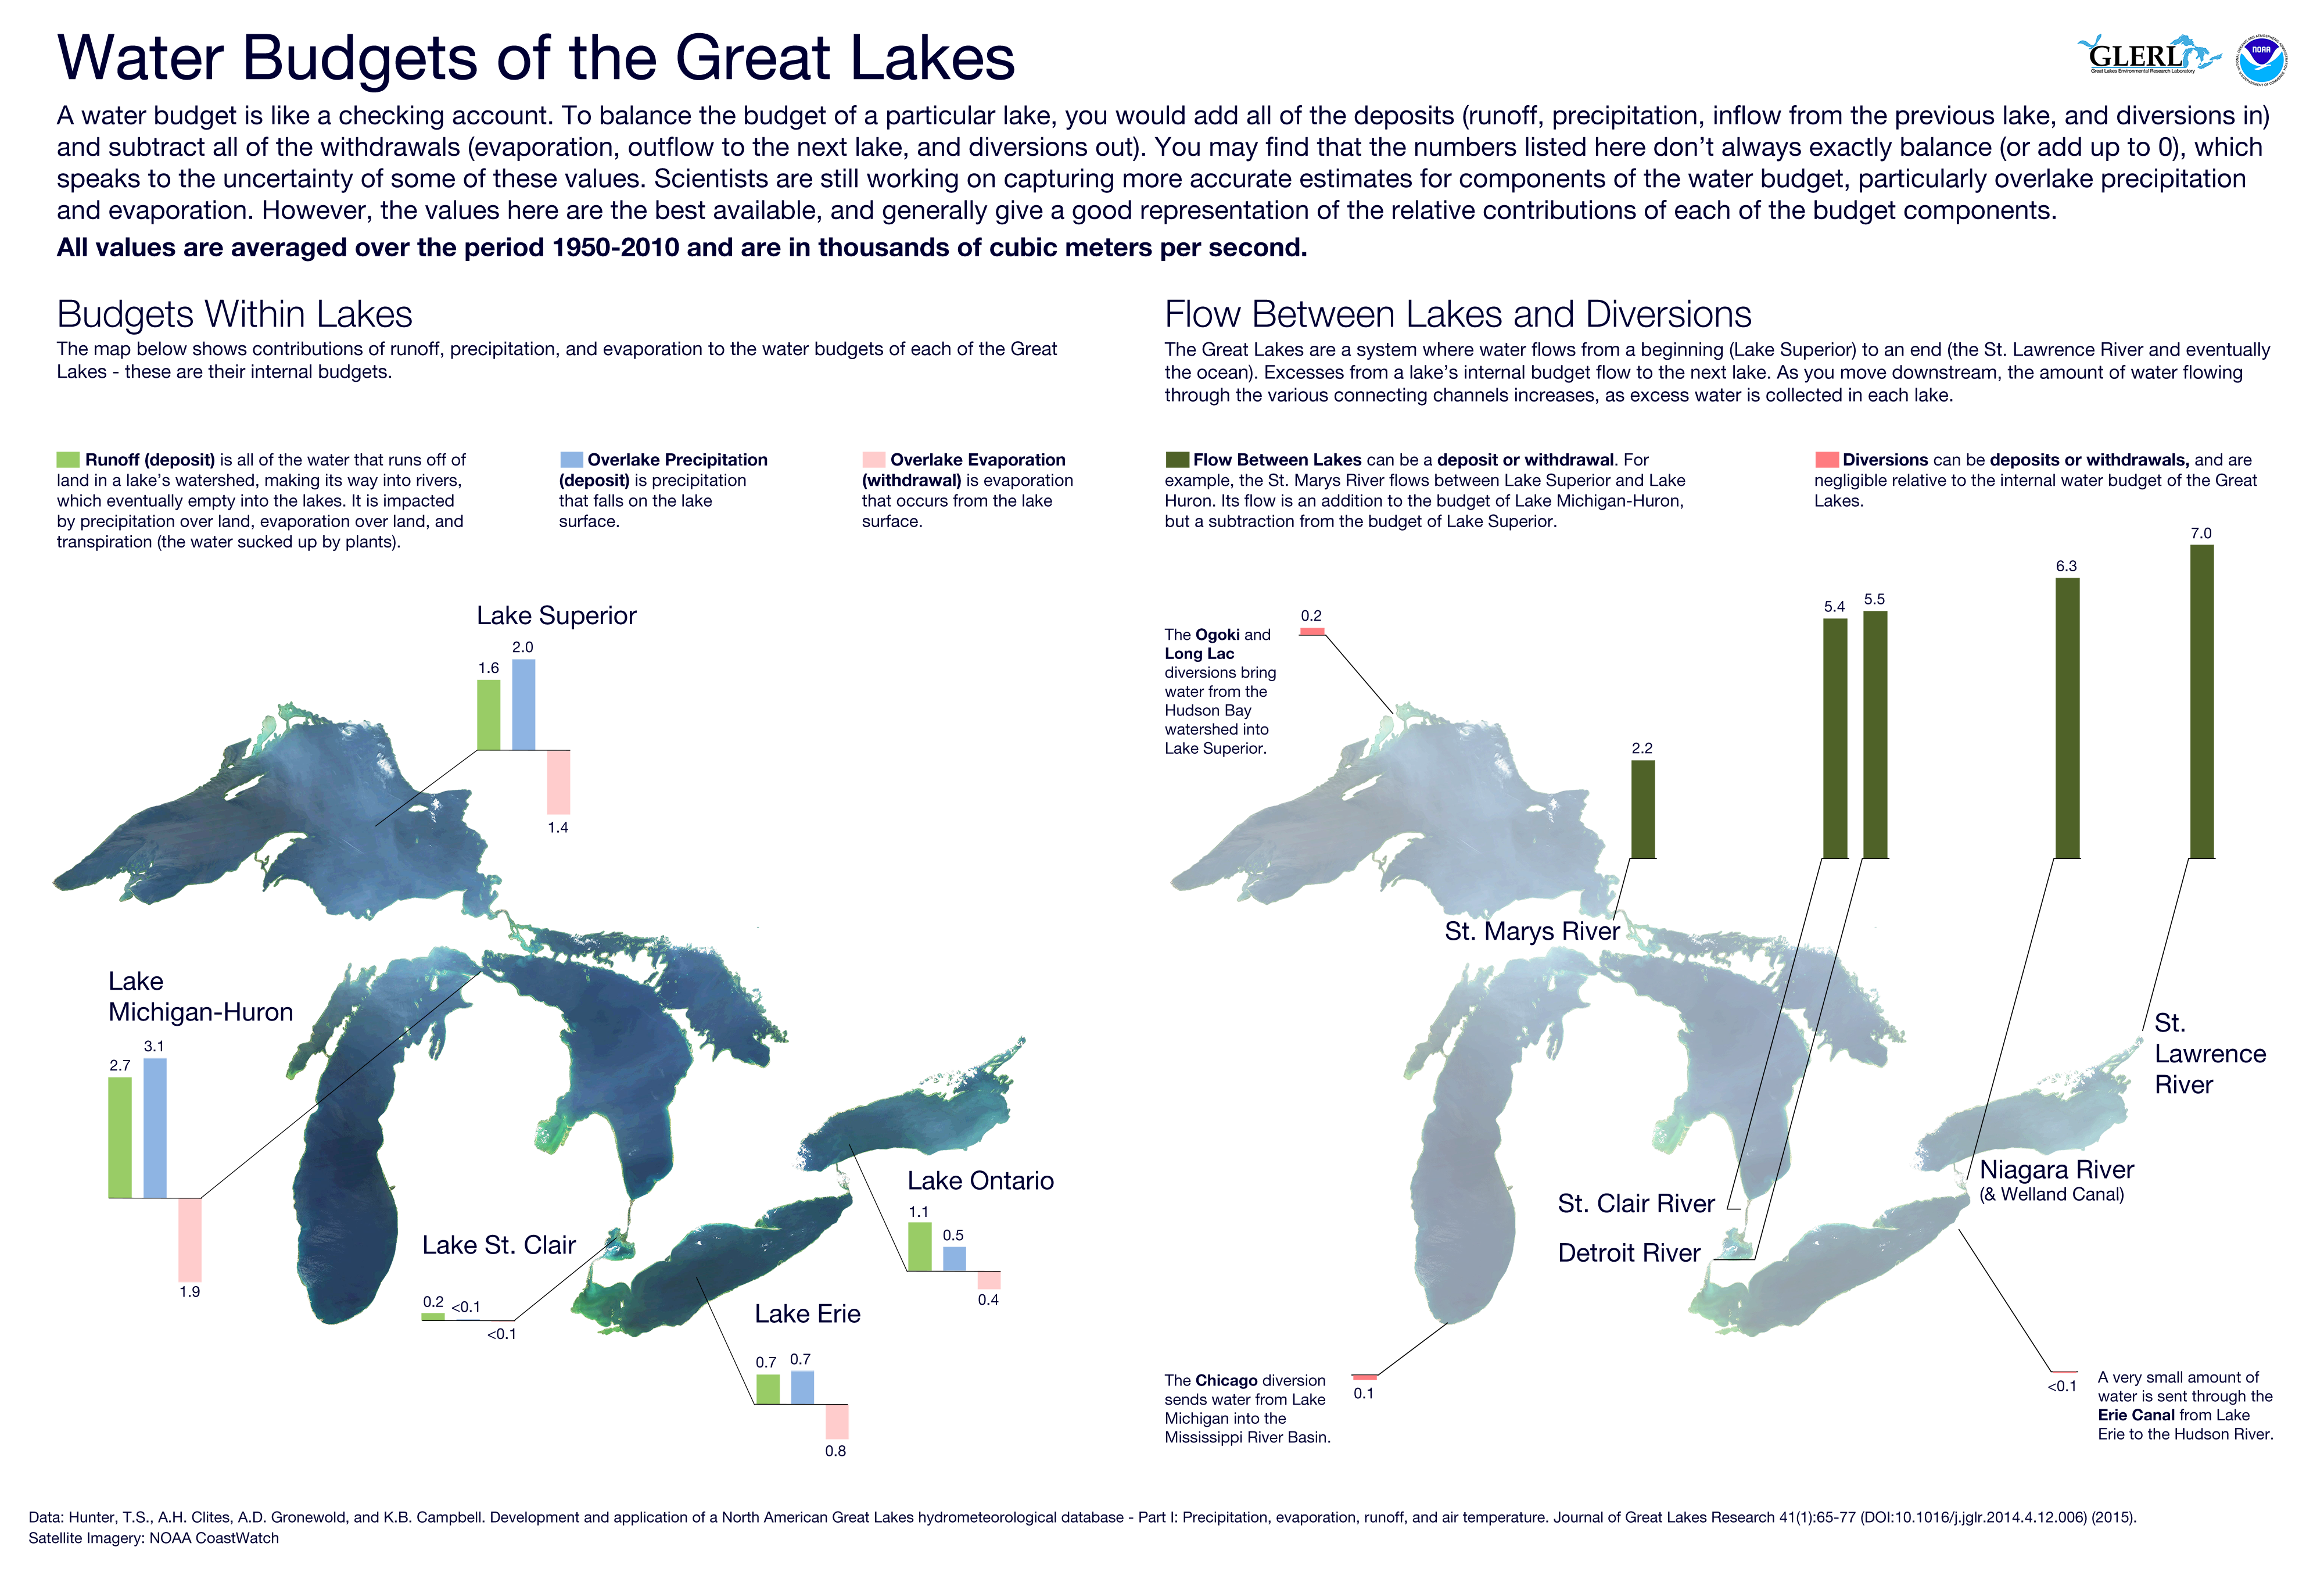
At GLERL, research on water levels in the Great Lakes analyzes all of the components of the Great Lakes water budget. The information we gather is used to improve forecast models. The infographic below goes into more detail about the Great Lakes water budget.

Image depicting the makeup of water budgets in the Great Lakes

How does winter ice cover affect water levels?

As mentioned in the recently released Quarterly Climate Impacts and Outlook for the Great Lakes, water levels in the Great Lakes tend to decline in late fall and early winter, mainly due to reduced runoff and streamflow combined with higher over-lake evaporation caused by the temperature difference between air and water. Factors such as surface water temperatures, long stretches of cold or warm air temperatures, and winds all impact the amount of lake ice cover as well as extreme winter events, such as lake-effect snow—which we’ve already seen plenty of this winter—and vice versa. All of these factors influence winter water levels in the Great Lakes. The timing and magnitude of snow melt and spring runoff will be major players in the spring rise.

Looking for more info?

You can find more about GLERL’s water levels research, on this downloadable .pdf of the GLERL fact sheet on Great Lakes Water Levels.

View current, historical, and projected water levels on the Great Lakes Water Levels Dashboard at https://www.glerl.noaa.gov/data/dashboard/portal.html.

For more on GLERL’s research on ice in the Great Lakes, check out the Great Lakes Ice fact sheet, or check out our website at https://www.glerl.noaa.gov/data/ice/.

Want to see a really cool graphic showing the extent of the maximum ice cover on the Great Lakes for each year since 1973? You’ll find that here.


Leave a comment

New algorithm to map Great Lakes ice cover

Leshkvich sampling ice

GLERL researcher, George Leshkevich, drilling through the ice in Green Bay, Lake Michigan.

NOAA’s Great Lakes Environmental Research Laboratory (GLERL) is on the cutting edge of using satellite remote sensing to monitor different types of ice as well as the ice cover extent. To make this possible, an algorithm—a mathematical calculation developed at GLERL to retrieve major Great Lakes ice types from satellite synthetic aperture radar (SAR) data—has been transferred to NOAA’s National Environmental Satellite, Data, and Information Service (NESDIS) for evaluation for operational implementation.

Once operational, the algorithm for Great Lakes ice cover mapping holds multiple applications that will advance marine resource management, lake fisheries and ecosystem studies, Great Lakes climatology, and ice cover information distribution (winter navigation).  Anticipated users of the ice mapping results include the U.S. Coast Guard (USCG), U.S. National Ice Center (NIC), and the National Weather Service (NWS).

For satellite retrieval of key parameters (translation of satellite imagery into information on ice types and extent), it is necessary to develop algorithms specific to the Great Lakes owing to several factors:

  • Ocean algorithms often do not work well in time or space on the Great Lakes
  • Ocean algorithms often are not tuned to the parameters needed by Great Lakes stakeholders (e.g. ice types)
  • Vast difference exists in resolution and spatial coverage needs
  • Physical properties of freshwater differ from those of saltwater

The relatively high spatial and temporal resolution (level of detail) of SAR measurements, with its all-weather, day/night sensing capabilities, make it well-suited to map and monitor Great Lakes ice cover for operational activities. Using GLERL and Jet Propulsion Lab’s (JPL) measured library of calibrated polarimetric C-band SAR ice backscatter signatures, an algorithm was developed to classify and map major Great Lakes ice types using satellite C-band SAR data (see graphic below, Methodology for Great Lakes Ice Classification prototype).

ICECON (ice condition index) for the Great Lakes—a risk assessment tool recently developed for the Coast Guard—incorporates several physical factors including temperature, wind speed and direction, currents, ice type, ice thickness, and snow to determine 6 categories of ice severity for icebreaking operations and ship transit.  To support the ICECON ice severity index, the SAR ice type classification algorithm was modified to output ice types or groups of ice types, such as brash ice and pancake ice to adhere to and visualize the U.S. Coast Guards 6 ICECON categories. Ranges of ice thickness were assigned to each ice type category based on published freshwater ice nomenclature and extensive field data collection. GLERL plans to perform a demonstration/evaluation of the ICECON tool for the Coast Guard this winter.

Mapping and monitoring Great Lakes ice cover advances NOAA’s goals for a Weather-Ready Nation and Resilient Coastal Communities and Economies, and Safe Navigation. Results from this project, conducted in collaboration with Son V. Nghiem (NASA/Jet Propulsion Laboratory), will be made available to the user community via the NOAA Great Lakes CoastWatch website (https://coastwatch.glerl.noaa.gov).


ice-types

ICECON Scale

Measuring different ice types on Green Bay used to validate the ICECON (ice type classification) Scale in a RADARSAT-2 synthetic aperture radar (SAR) scene taken on February 26, 2017.


Aerial photo survey improves NOAA GLERL’s Lake Erie ice model

1 Comment

Understanding the duration, extent, and movement of Great Lakes ice is important for the Great Lakes maritime industry, public safety, and the recreational economy. Lake Erie is ice-prone, with maximum cover surpassing 80% many winters.

Multiple times a day throughout winter, GLERL’s 3D ice model predicts ice thickness and concentration on the surface of Lake Erie. The output is available to the public, but the model is under development, meaning that modelers still have research to do to get it to better reflect reality.

As our scientists make adjustments to the model, they need to compare its output with actual conditions so they know that it’s getting more accurate. So, on January 13th of this year, they sent a plane with a photographer to fly the edge of the lake and take photos of the ice.

The map below shows the ice model output for that day, along with the plane’s flight path and the location of the 172 aerial photos that were captured.

NOAA GLERL Lake Erie ice model output with all aerial photo survey locations -- January 13, 2017. Credit NOAA GLERL/Kaye LaFond.

NOAA GLERL Lake Erie ice model output with all aerial photo survey locations — January 13, 2017. Map Credit NOAA GLERL/Kaye LaFond.

These photos provide a detailed look at the sometimes complex ice formations on the lake, and let our scientists know if there are places where the model is falling short.

Often, the model output can also be compared to images and surface temperature measurements taken from satellites. That information goes into the GLSEA product on our website (this is separate from the ice model). GLSEA is useful to check the ice model with. However, it’s important to get this extra information.

“These photographs not only enable us to visualize the ice field when satellite data is not available, but also allow us to recognize the spatial scale or limit below which the model has difficulty in simulating the ice structures.” says Eric Anderson, an oceanographer at GLERL and one of the modelers.

 “This is particularly evident near the Canadian coastline just east of the Detroit River mouth, where shoreline ice and detached ice floes just beyond the shoreline are not captured by the model. These floes are not only often at a smaller spatial scale than the model grid, but also the fine scale mechanical processes that affect ice concentration and thickness in this region are not accurately represented by the model physics.”

Click through the images below to see how select photos compared to the model output. To see all 172 photos, check out our album on Flickr. The photos were taken by Zachary Haslick of Aerial Associates.


This gallery contains 10 photos