Many people have questions about the historically low Great Lakes ice cover this winter, and we’ve got answers! NOAA GLERL’s Bryan Mroczka (Physical Scientist) and Andrea Vander Woude (Integrated Physical and Ecological Modeling and Forecasting Branch Chief) answer the following frequently asked questions regarding the causes and impacts of this year’s low ice cover.
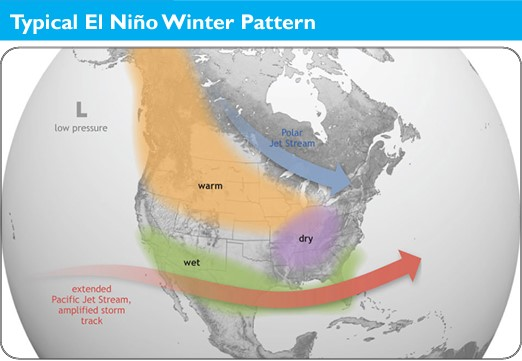
What’s driving the lack of ice? Is El Niño involved somehow?
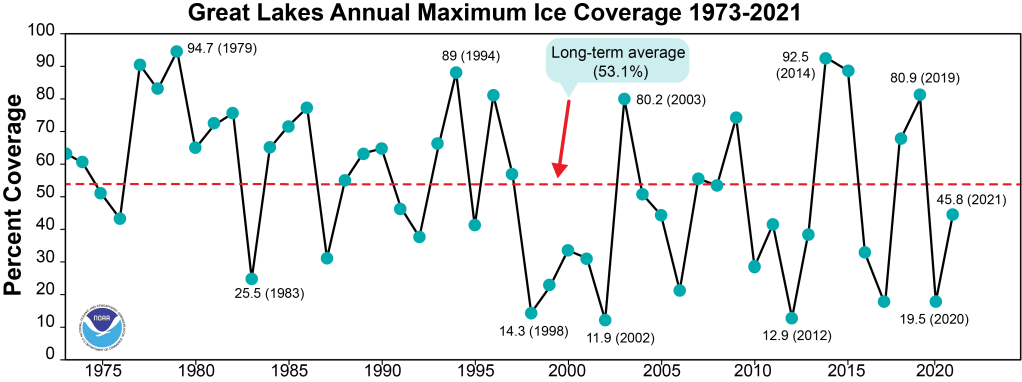
The long-term trend shows a decline in ice cover in the Great Lakes region over the past several decades. Ice cover has been decreasing by approximately 5 percent per decade, for a 25 percent total decrease between 1973 and 2023. In addition, the length of the Great Lakes ice season has decreased by approximately 27 days on average over the same period.
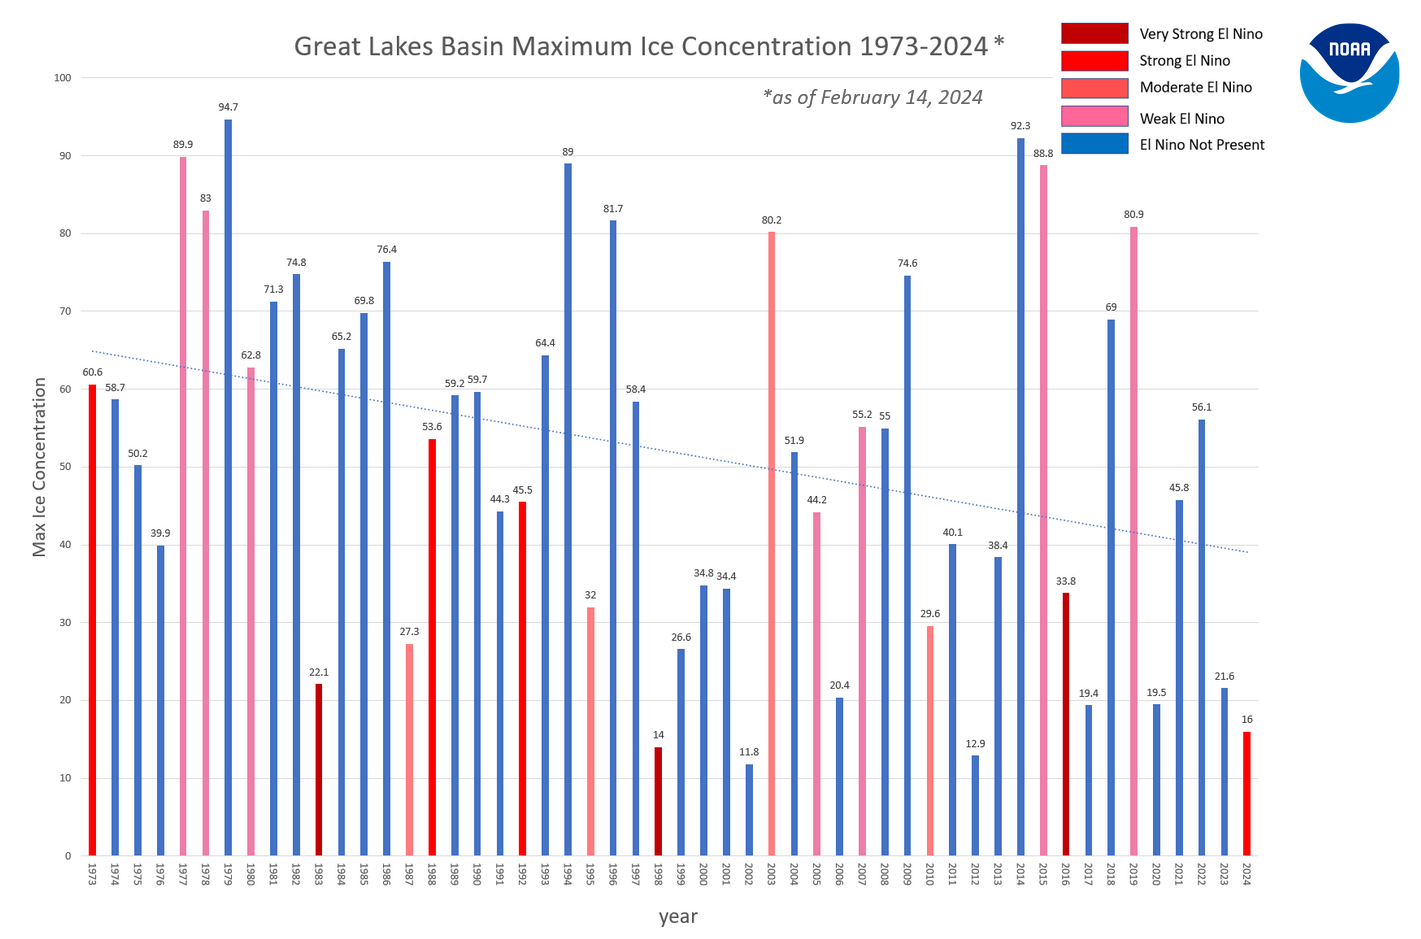
Factors that drive the lack of ice are climatic variables such as the El Niño-Southern Oscillation (ENSO) along the Equatorial Pacific in addition to other global oceanic oscillations. These atmospheric patterns in the ocean influence weather patterns in the Great Lakes, driving the climatic response of the lakes. Increases in air temperatures are responsible for the lack of ice in addition to the “heat memory” of the lakes as they retain heat from the summer season temperatures.
While El Niño may have exacerbated the extreme low ice seen this year, the increased frequency of low ice years across the lakes is tied to generally warmer winter conditions, defined by fewer and generally shorter intrusion of arctic air into the region. While much of the Continental U.S. has seen a warming trend during the winter months, the upper Midwest/Great Lakes have seen some of the most dramatic warming.
An important factor in a season’s ice potential across the Great Lakes is the weather patterns influencing the region during December. December is what we would consider a “priming” month, in which the first arctic air masses cool the lakes and begin the ice generation process within enclosed bays and along the shoreline. Recently, we have seen a multitude of Decembers exhibit above-average temperatures, including significantly above-average temperatures this winter in particular. The lack of early season cold air, and resulting late start to the ice generation season makes later significant gains in ice concentration harder to achieve.
How does the lack of ice impact the Great Lakes ecosystem, as well as towns and cities on the lakes?
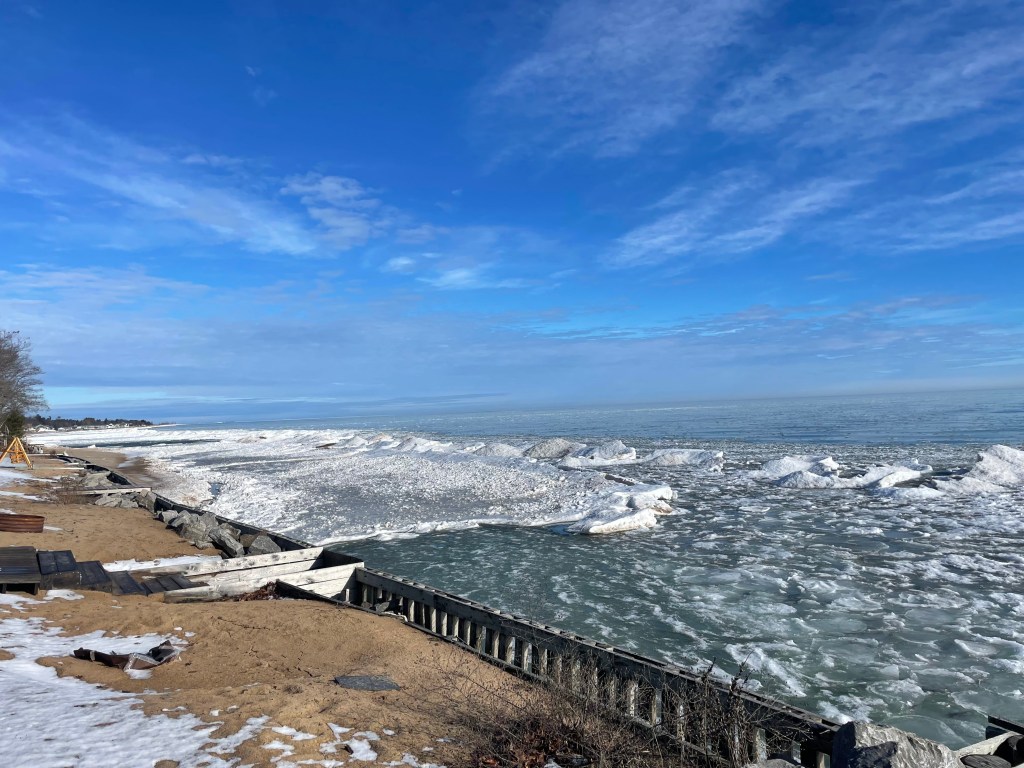
Ice is an important element for the ecosystems, economy, and coastal resilience across the Great Lakes. Ice is a natural part of the Great Lakes yearly cycle and many animal species, from microbial to larger fauna, rely on the ice for protecting young and harboring eggs. The Great Lakes also see most of their significant storms and large wave events during the colder months of late fall through winter. The shorebound ice sheets act as an important buffer against these waves, protecting the coast from erosion and damage to shoreline infrastructure. In years with very low ice, such as this one, the coast becomes more susceptible to the full onslaught of wave energy.
The economy of the Great Lakes can see negative and positive outcomes from a very low ice year. Two of the more important wintertime recreational sports in the Great Lakes include ice-fishing and snowmobiling. When the ice is scarce and thin, the ability to partake in ice-fishing is significantly reduced both spatially and temporally. When it comes to snowmobiling, warmer winters will generally result in more rain events compared to normal, as well as reduced snow cover and lower quality snow.
One “silver lining” for the Great Lakes economy that may result from a low ice year, is a boost to the shipping industry. Low ice years are likely to extend the shipping season across the lakes, and may extend the season significantly if the locks are not hampered by significant ice.
Is there still time for the ice to return before spring?
The ice season in the Great Lakes typically extends until the end of March, and the maximum ice cover for the year comes near the end of February to early March. The clear trend is one of decreasing ice, but it is still too early to determine how this year will ultimately compare to past years and the long term average.
Winter is not close to being over, and periods of new ice generation are almost certain as we head through the next month. The longer term pattern into early March does suggest that a few bouts of arctic air will reach the Great Lakes, but similar to earlier portions of this winter, there does not appear to be a signal for any long term below average temperature events. The colder air events ahead are more likely to be short-lived (several days), and not long enough for significant gains in ice concentration. It is certainly possible that we’ll see the ice concentrations climb out of the current historic lows before the end of the month, but a major pattern shift (currently not in the forecast) would be required to drive ice concentrations out of below-normal realms for any of the lakes before the spring.
How do low ice levels impact evaporation, water levels, and lake effect snow?
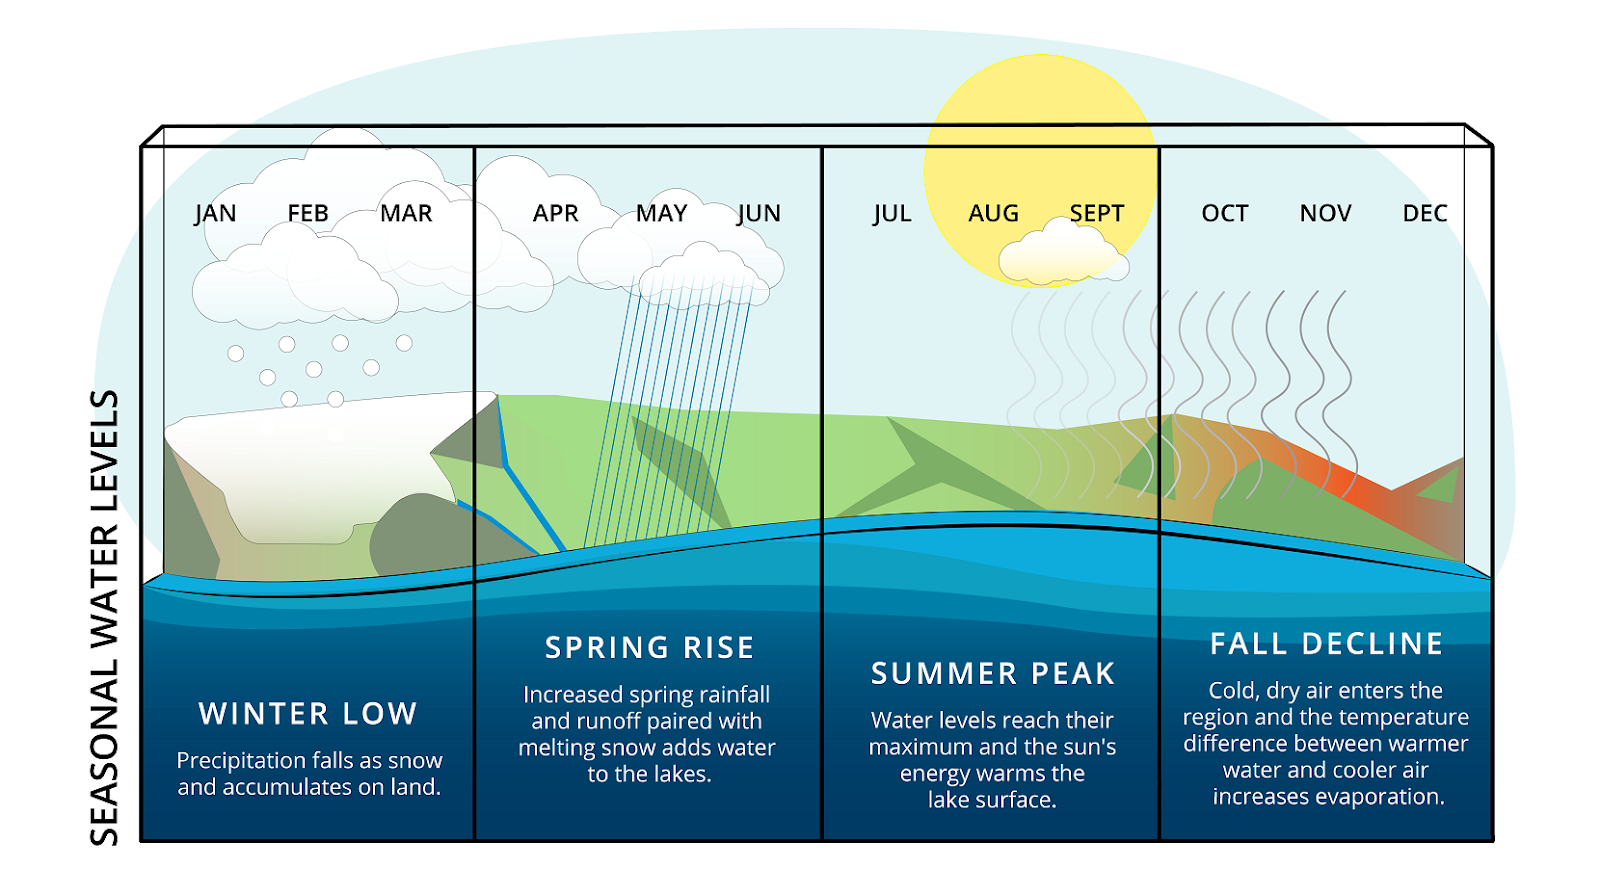
While Great Lakes water levels are generally lowest in the winter, most of the evaporation from the lakes actually happens in the fall. This is because evaporation is driven by a large difference between the air temperature and the water temperature, which happens in the fall when the air cools down but the water is still holding onto its summer heat. The graphic below illustrates the seasonal cycles that Great Lakes water levels undergo every year.
As of right now, we are not seeing any significant impacts to water levels due to the lower ice. Water levels are essentially the same (within one inch) as the values we were seeing at this time last year, and running just a touch above the long term average. The U.S. Army Corps of Engineers is forecasting very little change in water levels for the next 6 months. The lakes are almost ice-free, but we are also not seeing any significant degree or duration of arctic air. Despite the lack of ice, the water temperatures are still cold – just a few degrees above freezing – so the generally small difference in water temperature and air temperature means that evaporation levels are kept in check.
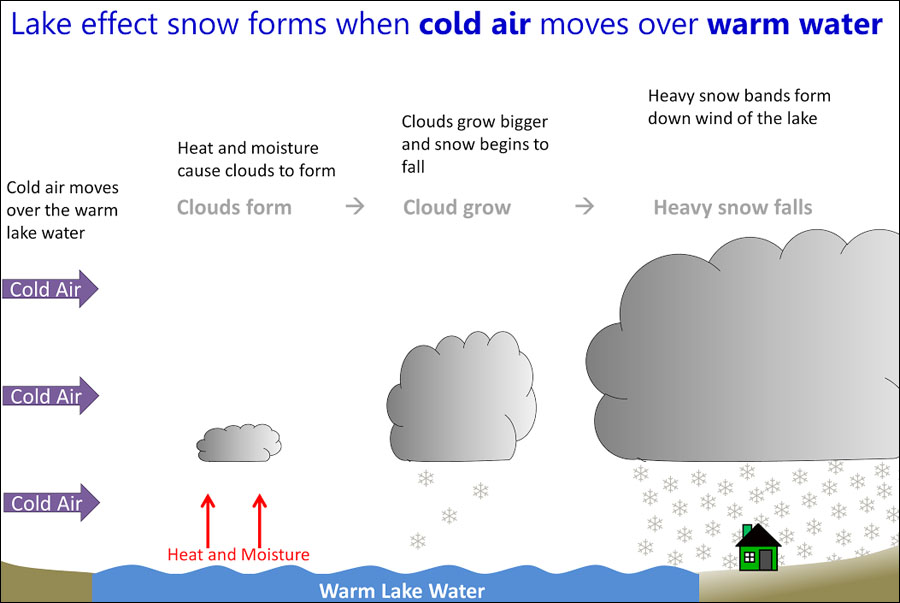
One might assume that the lakes remaining ice-free might increase the amounts of lake effect snow, and this is possible given there is still a steady supply of colder air supportive of driving the lake effect. However, this winter, the lack of cold air arriving over the region has reduced the lake effect snow events, and promoted significant melting between events.
Why do NOAA GLERL’s ice records only go back to 1973?
The early 1970s is when we first had reliable satellite data with which to construct more accurate and complete datasets. Before the satellite era, information during the winter about ice concentration away from the shoreline was very limited. This is why we only use the 51-year dataset for our calculations, as this represents the highest quality data.
Learn more about this year’s low Great Lakes ice
Current and historical ice cover data from NOAA GLERL
NOAA Research: Great Lakes ice cover reaches historic low
Climate.gov: Ice coverage nearly nonexistent across the Great Lakes, as the historical peak approaches
Download images and graphics from this article on our 2024 ice Flickr album