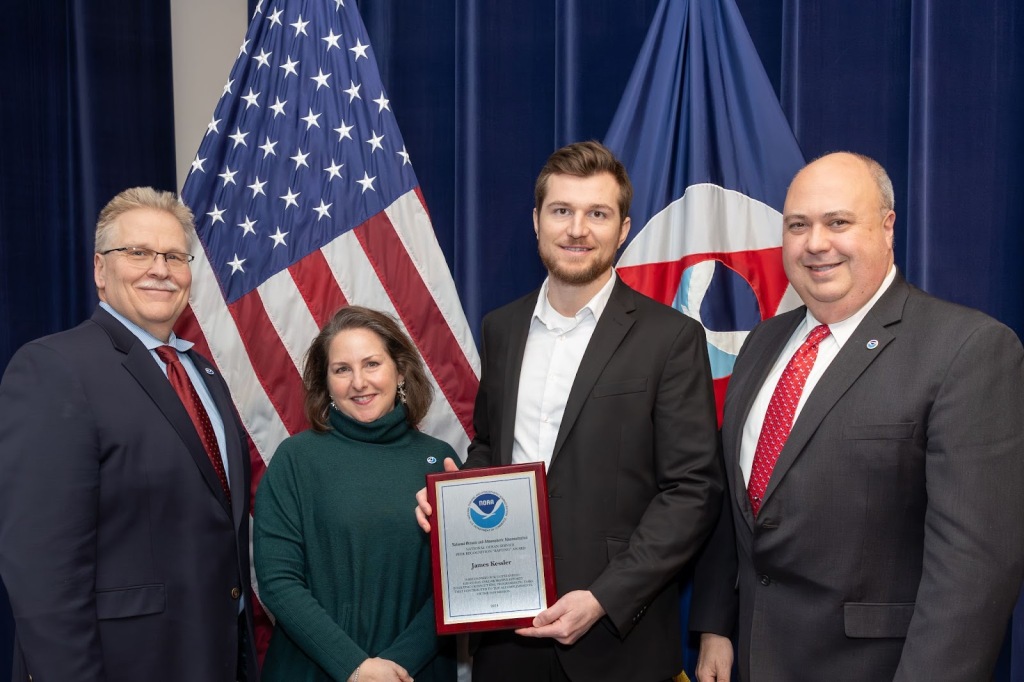
NOAA GLERL Physical Scientist James Kessler recently received a NOAA National Ocean Service (NOS) Peer Recognition Award for outstanding day-to-day collaborative efforts involving crosscutting programmatic tasks that contributed to the accomplishments of the NOS mission.
Peer Recognition “Rafting” Awards recognize coordination among NOS offices and provide NOS employees the opportunity to express their appreciation to another NOAA federal colleague that has helped them in some unique way. Congratulations, James, from all of us at NOAA GLERL!
The award nomination below describes James’ invaluable contributions to interagency collaborations between NOAA NOS, NOAA’s Office of Oceanic and Atmospheric Research (OAR), and the U.S. Coast Guard:
The Great Lakes contain 20 percent of the world’s surface freshwater supply and provide drinking water to over 40 million people. When a pollution event or natural disaster occurs, NOAA’s National Ocean Service Office of Response and Restoration (NOS/OR&R) is responsible for providing scientific analysis that supports decision makers recommendations of protecting life, property, and the environment. To accomplish this, OR&R often draws upon subject matter expertise from other parts of NOAA. This award is to recognize the outstanding professional performance of James Kessler (OAR/GLERL) when selected to participate and support two different OR&R events.
The first was an invitation for Mr. Kessler to participate in the U.S. Coast Guard (USCG) led oil spill exercise held in Roger’s City, MI on July 19, 2022. Showcasing NOAA’s role and ability to provide unified scientific support to the USCG during a spill emergency is imperative. The success of this public event with an audience of federal, state, and local emergency responders was a testament to the positive collaboration between NOS/OR&R and OAR. This particular exercise was significant as the USCG obtained approval to use a highly visible green dye in the water to mimic spilled oil in order to highlight environmental transport in the exercise area. Without previous emergency response experience, James Kessler provided detailed information on the hydrodynamic properties of Lake Huron with uncommon zeal and vitality. He developed an oil dispersion animation for the exercise scenario using the Great Lakes Operational Forecast System (GLOFS), ran the model during the event, and presented to over 100 attendees the GLOFS, High-Resolution Rapid Refresh (HRRR), and Global Forecast System (GFS) systems. Mr. Kessler displayed expert knowledge of NOAA Great Lakes capabilities including the Great Lakes Observing System (GLOS) and often brought in a representative to discuss observation systems and gaps in coverage with interested stakeholders.
The collaboration between OR&R and GLERL directly reflected NOS priorities of preparedness and risk reduction; as well as NOAA’s strategic priorities of communicating NOAA’s comprehensive observing systems and partnerships in the Great Lakes that improve data delivery and services to government and state agencies, as well as private industry stakeholders. In another example representing Mr. Kessler’s support, the newly established USCG Center of Expertise (COE) in partnership with the OR&R, funded a research project to test uncrewed aircraft systems’ (UAS) ability to collect and share data from a USCG vessel in an ice environment. James Kessler joined the project planning team in January and delivered time critical analysis of current and historical ice data for the Great Lakes.
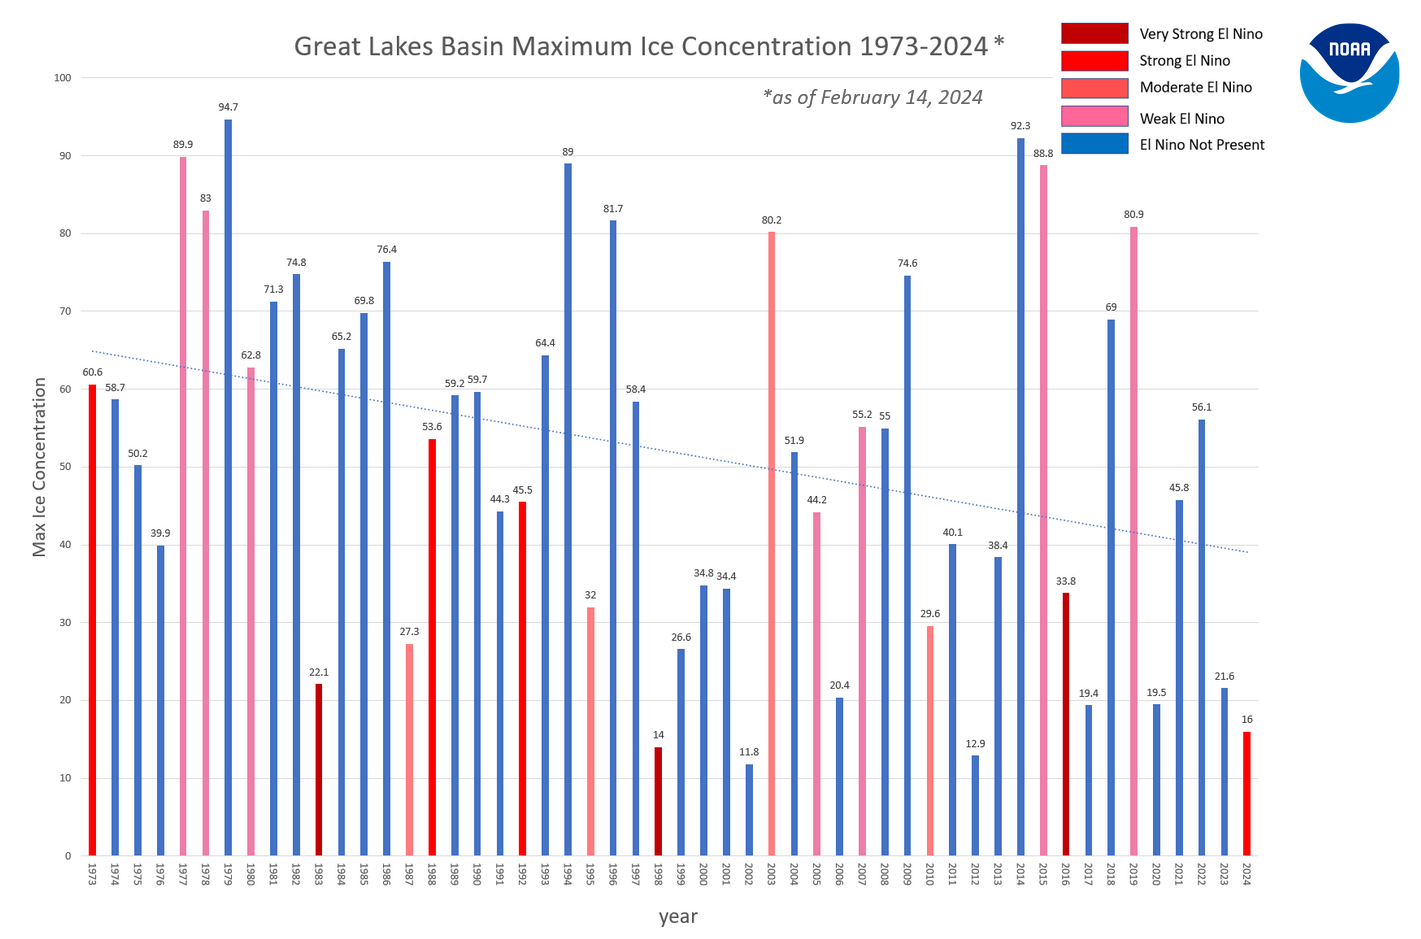
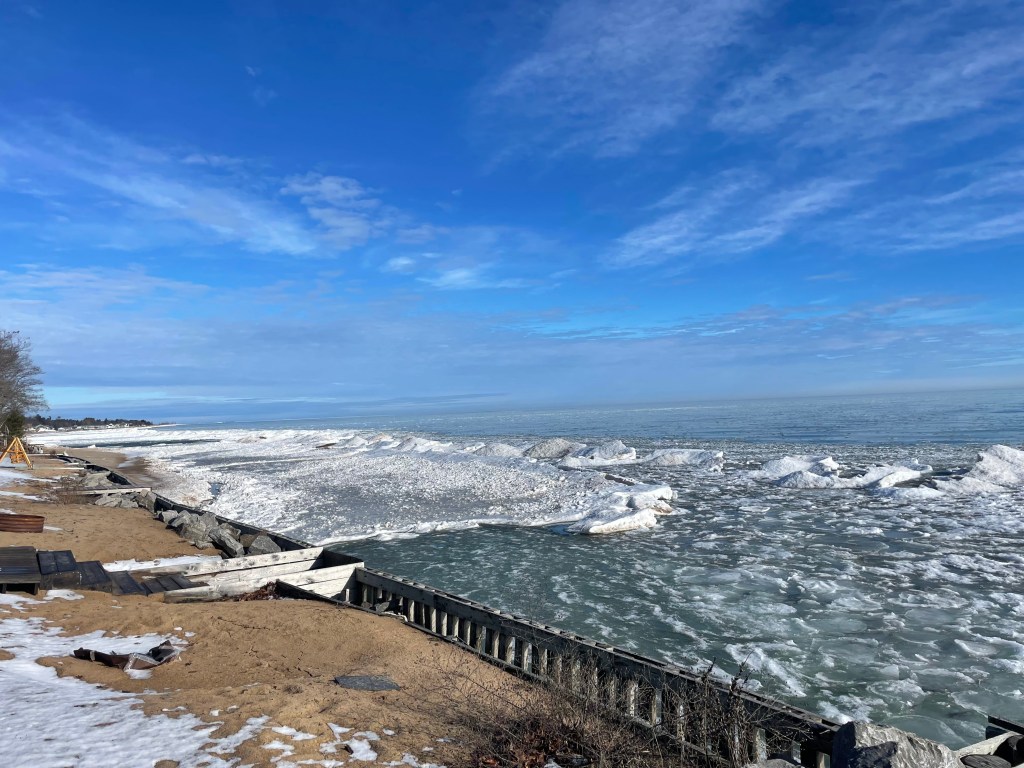
Mr. Kessler’s astute analysis of ice data archives between 1973-present and initiative to generate time series plots provided concrete information for project managers to shift the dates and location of the project to ensure proper ice conditions. As a result, the field deployment component of the project was moved from January 22 in Port Huron, to March 6 in Duluth, MN and directly led to the successful capture of a USCG vessel breaking fresh ice and completion of the first field experiment funded by the COE. The successful outcome of this project also led to defining protocols for data sharing between USCG and NOAA that will vastly improve product support for pollution spills and disaster responses nationwide. While in the field, Mr. Kessler’s charisma was noted on a daily basis by USCG SES and earned him a deep sense of respect by all within the project team. His exceptional professional knowledge, enthusiasm, and dedication to mission contributed significantly and was the motivating force to keep collaborative efforts between NOS/OR&R, GLERL, and USCG moving forward.