NOAA Great Lakes Environmental Research Laboratory

The latest news and information about NOAA research in and around the Great Lakes


Leave a comment

Q&A with NOAA scientists: Causes and impacts of 2024’s historically low Great Lakes ice cover

Many people have questions about the historically low Great Lakes ice cover this winter, and we’ve got answers! NOAA GLERL’s Bryan Mroczka (Physical Scientist) and Andrea Vander Woude (Integrated Physical and Ecological Modeling and Forecasting Branch Chief) answer the following frequently asked questions regarding the causes and impacts of this year’s low ice cover.

What’s driving the lack of ice? Is El Niño involved somehow?

The long-term trend shows a decline in ice cover in the Great Lakes region over the past several decades. Ice cover has been decreasing by approximately 5 percent per decade, for a 25 percent total decrease between 1973 and 2023. In addition, the length of the Great Lakes ice season has decreased by approximately 27 days on average over the same period.

Annual maximum ice cover on the Great Lakes, 1973-2023.

Factors that drive the lack of ice are climatic variables such as the El Niño-Southern Oscillation (ENSO) along the Equatorial Pacific in addition to other global oceanic oscillations. These atmospheric patterns in the ocean influence weather patterns in the Great Lakes, driving the climatic response of the lakes. Increases in air temperatures are responsible for the lack of ice in addition to the “heat memory” of the lakes as they retain heat from the summer season temperatures. 

While El Niño may have exacerbated the extreme low ice seen this year, the increased frequency of low ice years across the lakes is tied to generally warmer winter conditions, defined by fewer and generally shorter intrusion of arctic air into the region. While much of the Continental U.S. has seen a warming trend during the winter months, the upper Midwest/Great Lakes have seen some of the most dramatic warming.

Color-coded chart showing maximum annual ice cover percentage on the Great Lakes from 1973-2024. Bar colors indicate El Niño strength for each year, ranging from "very strong El Niño" to "El Niño not present"
This graph shows maximum ice concentration every year from 1973-2024, with color-coding to show El Niño strength each year. Note that 2024’s maximum ice cover of 16% is as of mid-February, and is subject to change if ice cover increases later in the season.

An important factor in a season’s ice potential across the Great Lakes is the weather patterns influencing the region during December. December is what we would consider a “priming” month, in which the first arctic air masses cool the lakes and begin the ice generation process within enclosed bays and along the shoreline. Recently, we have seen a multitude of Decembers exhibit above-average temperatures, including significantly above-average temperatures this winter in particular. The lack of early season cold air, and resulting late start to the ice generation season makes later significant gains in ice concentration harder to achieve.

How does the lack of ice impact the Great Lakes ecosystem, as well as towns and cities on the lakes? 

Ice is an important element for the ecosystems, economy, and coastal resilience across the Great Lakes. Ice is a natural part of the Great Lakes yearly cycle and many animal species, from microbial to larger fauna, rely on the ice for protecting young and harboring eggs. The Great Lakes also see most of their significant storms and large wave events during the colder months of late fall through winter. The shorebound ice sheets act as an important buffer against these waves, protecting the coast from erosion and damage to shoreline infrastructure. In years with very low ice, such as this one, the coast becomes more susceptible to the full onslaught of wave energy.
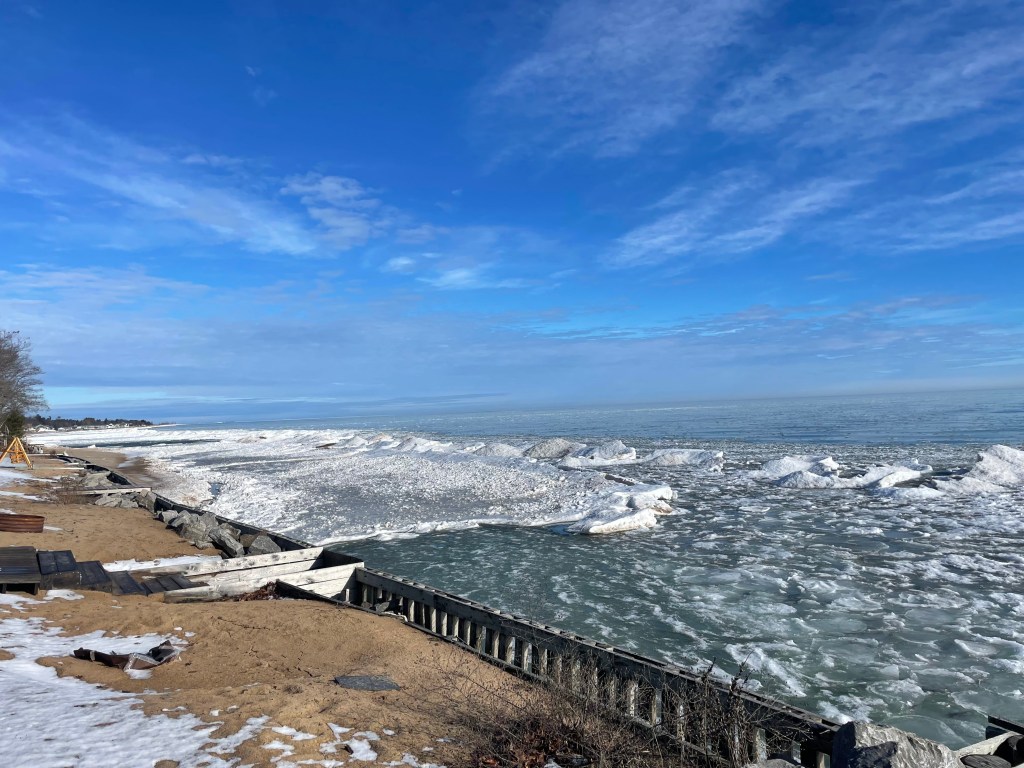
An ice shelf and pieces of floating ice line a residential seawall on Lake Huron on a sunny day.
Ice on the Lake Huron shoreline near Oscoda, MI on January 27, 2024. Credit: Clarice Farina

The economy of the Great Lakes can see negative and positive outcomes from a very low ice year. Two of the more important wintertime recreational sports in the Great Lakes include ice-fishing and snowmobiling. When the ice is scarce and thin, the ability to partake in ice-fishing is significantly reduced both spatially and temporally. When it comes to snowmobiling, warmer winters will generally result in more rain events compared to normal, as well as reduced snow cover and lower quality snow. 

One “silver lining” for the Great Lakes economy that may result from a low ice year, is a boost to the shipping industry. Low ice years are likely to extend the shipping season across the lakes, and may extend the season significantly if the locks are not hampered by significant ice. 

Is there still time for the ice to return before spring?

The ice season in the Great Lakes typically extends until the end of March, and the maximum ice cover for the year comes near the end of February to early March. The clear trend is one of decreasing ice, but it is still too early to determine how this year will ultimately compare to past years and the long term average. 

Winter is not close to being over, and periods of new ice generation are almost certain as we head through the next month. The longer term pattern into early March does suggest that a few bouts of arctic air will reach the Great Lakes, but similar to earlier portions of this winter, there does not appear to be a signal for any long term below average temperature events. The colder air events ahead are more likely to be short-lived (several days), and not long enough for significant gains in ice concentration. It is certainly possible that we’ll see the ice concentrations climb out of the current historic lows before the end of the month, but a major pattern shift (currently not in the forecast) would be required to drive ice concentrations out of below-normal realms for any of the lakes before the spring. 

How do low ice levels impact evaporation, water levels, and lake effect snow?

While Great Lakes water levels are generally lowest in the winter, most of the evaporation from the lakes actually happens in the fall. This is because evaporation is driven by a large difference between the air temperature and the water temperature, which happens in the fall when the air cools down but the water is still holding onto its summer heat. The graphic below illustrates the seasonal cycles that Great Lakes water levels undergo every year.

Graphic showing land in the background and water in the foreground, divided into four panels corresponding with the seasons. Text describes the water level changes throughout the year: Winter low, spring rise, summer peak, and fall decline.

As of right now, we are not seeing any significant impacts to water levels due to the lower ice. Water levels are essentially the same (within one inch) as the values we were seeing at this time last year, and running just a touch above the long term average. The U.S. Army Corps of Engineers is forecasting very little change in water levels for the next 6 months. The lakes are almost ice-free, but we are also not seeing any significant degree or duration of arctic air. Despite the lack of ice, the water temperatures are still cold – just a few degrees above freezing – so the generally small difference in water temperature and air temperature means that evaporation levels are kept in check.

One might assume that the lakes remaining ice-free might increase the amounts of lake effect snow, and this is possible given there is still a steady supply of colder air supportive of driving the lake effect. However, this winter, the lack of cold air arriving over the region has reduced the lake effect snow events, and promoted significant melting between events.

Why do NOAA GLERL’s ice records only go back to 1973?

The early 1970s is when we first had reliable satellite data with which to construct more accurate and complete datasets. Before the satellite era, information during the winter about ice concentration away from the shoreline was very limited. This is why we only use the 51-year dataset for our calculations, as this represents the highest quality data.

Learn more about this year’s low Great Lakes ice

Current and historical ice cover data from NOAA GLERL

NOAA Research: Great Lakes ice cover reaches historic low

Climate.gov: Ice coverage nearly nonexistent across the Great Lakes, as the historical peak approaches

Download images and graphics from this article on our 2024 ice Flickr album


Leave a comment

Decades in the making, NOAA’s newest Lake Superior and Lake Ontario forecast systems become fully operational

Did you know that NOAA operates a forecasting system that predicts water conditions on the Great Lakes? Whether you’re wondering about a lake’s temperature, currents, or water level changes, NOAA’s got you covered! This fall, NOAA implemented newly updated versions of the Lake Superior and Lake Ontario portions of this system, and added ice forecasts to all five lakes.

Lake Michigan waves at the St. Joseph North Pier Lighthouses following superstorm Sandy. October 29, 2012. Credit: S. Lashley, NOAA NWS.

GLOFS forecasts Great Lakes conditions

The publicly available Great Lakes Operational Forecast System (GLOFS) is a NOAA automated, model-based prediction system aimed at providing improved predictions of these conditions in the five Great Lakes (Erie, Michigan, Superior, Huron and Ontario) for the commercial, recreation, and emergency response communities. GLOFS models use current lake conditions and predicted weather patterns to forecast the lake conditions for up to five days (120 hours) in the future. GLOFS predictions enable users to increase the margin of safety and maximize the efficiency of commerce throughout the Great Lakes.

NOAA’s National Weather Service (NWS) and National Ocean Service (NOS) work together to run GLOFS operationally on NOAA’s High Performance Computing System. By running on NOAA’s High Performance Computing System, GLOFS has direct access to National Weather Service operational meteorological products that are required for reliable and timely operations.

A major update for Lakes Ontario and Superior

A key goal of NOAA’s Research branch is to continually make forecasts better, and GLERL scientists play a major role in improving the models that constitute GLOFS. Like the rest of GLOFS, the Lake Ontario and Lake Superior portions – Lake Ontario Operational Forecast System (LOOFS) and Lake Superior Operational Forecast System (LSOFS) – were originally based on the Princeton Ocean Model. As of October 2022, they’ve now been upgraded with higher-resolution versions that are based on a newer computer model.

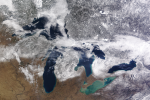
MODIS satellite images of Lakes Superior (left) and Ontario (right) in March 2021.

The new LOOFS and LSOFS use the Finite Volume Community Ocean Model (FVCOM), coupled with an unstructured grid version of the Los Alamos Sea Ice model (CICE). The new model provides users with higher resolution of nowcast (near-present conditions) and forecast guidance of water levels, currents, water temperature, ice concentration, ice thickness and ice velocity out to 120 hours in the future, and it updates four times per day. By invoking advanced model schemes and algorithms, LOOFS and LSOFS are expected to generate a more accurate model output than their former versions. 

Before they were ready to become operational, the new versions of LOOFS and LSOFS were run experimentally at GLERL for several years, where they underwent extensive testing and evaluation. GLERL played a key role in developing these models and ran them as part of the Great Lakes Coastal Forecasting System (GLCFS) – an experimental version of GLOFS that GLERL uses to prepare new models to become operational.

With this transition, the GLOFS models for all five Great Lakes have now been upgraded to FVCOM versions, as the Lake Erie model was upgraded in 2016, and the Lake Michigan-Huron model was upgraded in 2019. A new FVCOM-based model for the Huron-Erie Corridor, which includes Lake St. Clair and both the St. Clair and Detroit Rivers, is scheduled to be added to GLOFS in 2023. Read more about the LOOFS and LSOFS transition here.

These output maps from the current 3rd generation GLOFS show Lake Superior wind speed
and direction (top) and Lake Ontario water temperatures (bottom).

GLERL has been improving GLOFS for over 30 years

GLOFS is based on the Great Lakes Forecasting System, originally developed by The Ohio State University (OSU) and GLERL in the late 1980s and 1990s under the direction of Dr. Keith Bedford (OSU) and Dr. David Schwab (NOAA GLERL). The original forecasting systems utilized the Princeton Ocean Model (POM) and used a set of uniformly structured bathymetric grids. The first routine nowcast, using a low-resolution grid for Lake Erie, began at OSU in 1992.

Starting in 2002, GLERL’s semi-operational GLCFS was expanded to five lakes using medium-resolution grids (5 – 10 km) and 48-hr forecasts were added. This version was successfully transferred from research to operations at NOAA NOS in 2010. The transition to operations at NOAA NOS was a joint effort between NOAA GLERL, NOS Center for Operational Oceanographic Products and Services (CO-OPS) and NOS Office of Coast Survey (OSC) Coast Survey Development Laboratory (CSDL), private industry, and academia (OSU).

NOAA GLERL has continued to make improvements to the experimental GLCFS; these include increasing the grid resolution (2 – 10 km), adding ice dampening and an ice model, and extending the forecasts to 120 hours during the period of 2006-2014 (generation 2). The current 3rd generation of the GLOFS is what you see run by NOS today, with a resolution of 200m to 2.5km and producing 120-hour forecasts.

The development and implementation of LSOFS and LOOFS is a joint project across several NOAA offices and external partners. 

  • NOAA National Ocean Service Center for Operational Oceanographic Products and Services
  • NOAA NOS Office of Coast Survey
  • NOAA Office of Oceanic and Atmospheric Research Great Lakes Environmental Research Laboratory
  • Finite Volume Community Ocean Model development group at the University of Massachusetts Dartmouth
  • NOAA National Weather Service National Centers for Environmental Prediction Central Operations


1 Comment

NOAA Wave Glider Camaro Gathers Key Data During 25-Day Cruise in Lake Superior


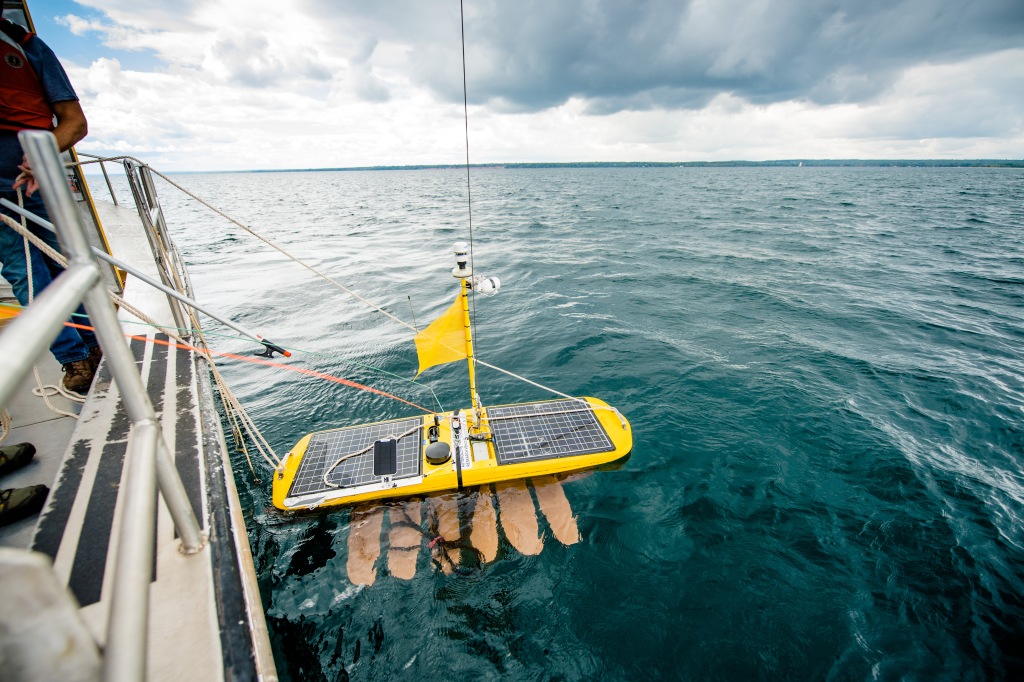
The NOAA Great Lakes Environmental Research Laboratory (GLERL) and Michigan Technological University (MTU) Great Lakes Research Center recently teamed up on the deployment of a wave glider in Lake Superior. The chemical and biological data collected will help researchers understand more about the Lake Superior foodweb and also be used to validate satellite information.

Autonomous wave glider that was recently deployed into Lake Superior by the MTU Great Lakes Research Center. Credit: Sarah Atkinson/Michigan Tech

Information gathered by autonomous vehicles, such as the wave glider, helps fine-tune satellite algorithms (instructions that tell a satellite how to interpret what it’s seeing). Satellites are a great tool for observing the lakes, as they provide a broader view than that from the ground. Researchers create Great Lakes-specific algorithms because those used in the ocean often do not work well in the lakes. The data collected by the wave glider will help validate the algorithms and allow researchers to understand more about the lakes, such as primary productivity (See MTU’s blog post for more.)

A team of researchers from MTU deployed the wave glider on August 30, 2021 and it spent 25 days surveying the lake and collecting data. The plan is to make the data public through the National Centers for Environmental Information (NCEI) so that information can be used in many ways including model development.

Path of the wave glider deployed on August 30th, 2021 and recovered on September 22, 2021 off the eastern coast of the Keweenaw Peninsula, near Bete Grise.

“It is a privilege for the Great Lakes Research Center to collaborate with NOAA GLERL on the wave glider experiment in Lake Superior, a first of its kind,” said Andrew Barnard, director of Michigan Tech’s Great Lakes Research Center. “This project continues to build a strong partnership between our organizations to push the boundaries of autonomy and sensing technologies. These new technologies in the Great Lakes support a better understanding of the physical processes in the lakes and will directly result in improved management insight for policy makers.”

Steve Ruberg of NOAA GLERL is thrilled with the MTU partnership as it expands our ability to collect data throughout the lakes. “Uncrewed vehicles give us the persistent large spatial observational capability to get in situ observations that will allow us to validate Great Lakes remote sensing.”

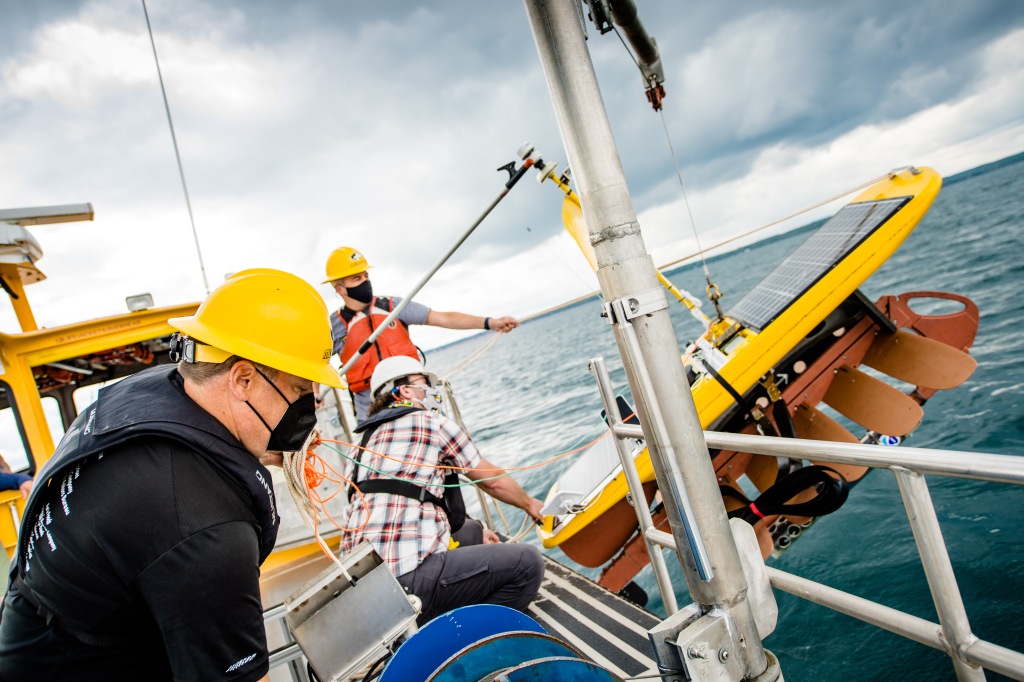
Left to right: Michigan Tech R/V Agassiz Jamey Anderson, assistant director of marine operations, Michigan Tech Great Lakes Research Center; Tim Havens, incoming director of the Great Lakes Research Center (January 2022) and John Lenters, associate research scientist at the Great Lakes Research Center ready the wave glider for deployment. Credit: Sarah Atkinson/Michigan Tech

This research project is a part of the Environmental Protection Agency’s Cooperative Science and Monitoring Initiative (CSMI). Federal and state agencies, tribal groups, non-governmental organizations and academic researchers from the United States and Canada team up yearly to assess conditions in one of the five Great Lakes. The survey focuses on a series of research areas that are tailored to the unique challenges and data needs associated with each lake.


9 Comments

Looking back: The ups and downs of Great Lakes ice cover in 2021

Ice formations cover a pier on the Lake Michigan shoreline in Holland, MI. February 27, 2021. Credit: Clarice Farina.

It’s no secret that the Great Lakes had a wild ride in terms of ice cover this past winter. From a slow start that led to near-record low ice cover in January, to the sudden widespread freeze just a few weeks later, here’s a look back at how ice cover on the lakes has fluctuated during the 2020-2021 ice season.

As we highlighted in our last blog post on historic ice data, January 2021 had the second-lowest overall Great Lakes ice cover on record since 1973 (with the very lowest being January 2002). For all five individual lakes, January 2021 was in the top five lowest ice-cover Januarys since 1973.

This graph shows average Great Lakes ice cover for the month of January every year from 1973 to 2021, organized by lowest ice cover (far left) to highest ice cover (far right). Credit: NOAA GLERL.

Starting out at 10.65% on February 1st, ice cover rose dramatically over the next three weeks with the region’s extreme cold weather. Growing quickly and steadily, total Great Lakes ice cover finally topped out at 45.84% on February 19th. But with air temperatures warming back up shortly afterwards, this spike was short-lived. Within a week it was back down to around 20% and continued to taper off, falling below 1% on April 3rd and reaching 0.1% on April 20.

This graph shows Great Lakes ice cover in 2021 (black line) compared to the historical average ice cover from 1973-2020 (red line). Credit: NOAA GLERL.

This Winter vs. The Long-Term Average

While all five lakes were far below their January average, each one did something a little different during February, when compared to its 1973-2020 average. The following graphs show this winter’s ice cover (black line) vs. the 1973-2020 average (red line) for each lake.⁣

Lake Erie ice cover jumped dramatically up to 81% in the second week of February, well above its average seasonal peak of around 65%. It stayed above 75% for about two weeks until falling back down below its average at the beginning of March.


Lake Michigan ice cover increased steadily throughout February, with its highest percentage being 33% on February 18th — only briefly staying above its average for that time period. It dropped off quickly the following week, then decreased gradually throughout March.

Lake Superior spent about a week in mid-February above its average ice cover for those days, peaking at about 51% on February 19th. Similar to Lake Michigan, it only stayed above its average for a short interval before rapidly falling back down under 20%.

Lake Ontario ice cover took a while to ramp up, staying below 10% until mid-February. It reached maximum ice cover on February 18th, topping out at about 21% – slightly higher than its average for that day.


Lake Huron was the only lake that did not reach above-average ice cover for the entire winter. Its peak ice cover was 48% on February 20th, which was about the same as its average for that time of year.

Melting into Spring

Throughout March, ice cover on all five lakes continued to decrease steadily, with the exception of a spike in ice cover around the second week of the month likely due to fluctuations in air temperature. For Lakes Erie and Ontario, this short-lived jump was enough to get them back up near their average early March ice cover for a few days. 

As for the timing of each lake’s peak 2021 ice cover compared with the average, Lakes Erie, Michigan, Huron, and Ontario all peaked later than their average, while Lake Superior is the only one that peaked earlier than its average.

Ice covers the Lake Huron shoreline in Oscoda, MI on February 15, 2021. Credit: G. Farina, NOAA GLERL.

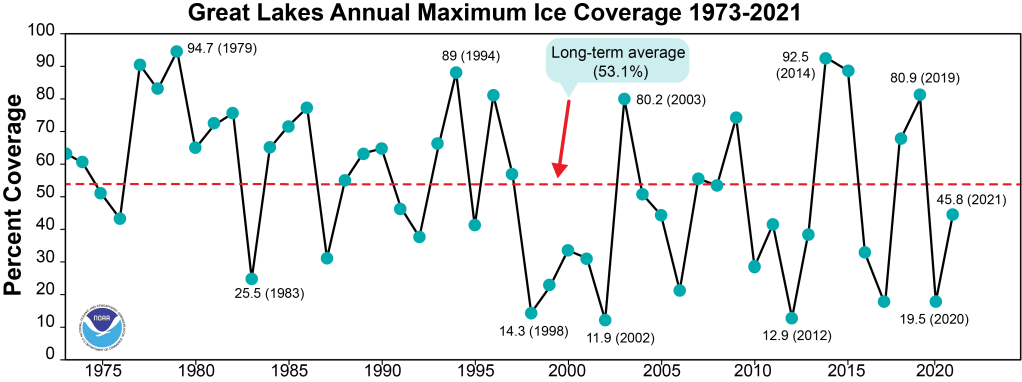
This winter’s maximum seasonal ice cover of 45.8% is just 7.5% less than the long-term average of 53.3%. While it’s below the average, it’s still more than double the 2020 seasonal maximum of 19.5% ice cover, but is just over half the 2019 seasonal maximum of 80.9%. With so much year-to-year variability, forecasting ice cover each year can be incredibly difficult. NOAA GLERL’s experimental ice forecast, updated in mid-February, predicted Great Lakes ice cover in 2021 to peak at 38% – not too far off from what it really was. NOAA GLERL continues to analyze both current and historical data to refine the ice forecast model, working to actively improve our experimental Great Lakes ice forecast each year.

This graph shows annual maximum ice cover on the Great Lakes each year from 1973 to 2021. Credit: NOAA GLERL.

For more on NOAA GLERL’s Great Lakes ice cover research and forecasting, visit our ice homepage here: https://go.usa.gov/xsRnM⁣

⁣Plus, access these graphs plus more Great Lakes CoastWatch graphs & data here: https://go.usa.gov/xsRnt⁣

Flat, jagged pieces of ice float in Lake Huron near Oscoda, MI on February 15, 2021. Credit: G. Farina, NOAA GLERL.